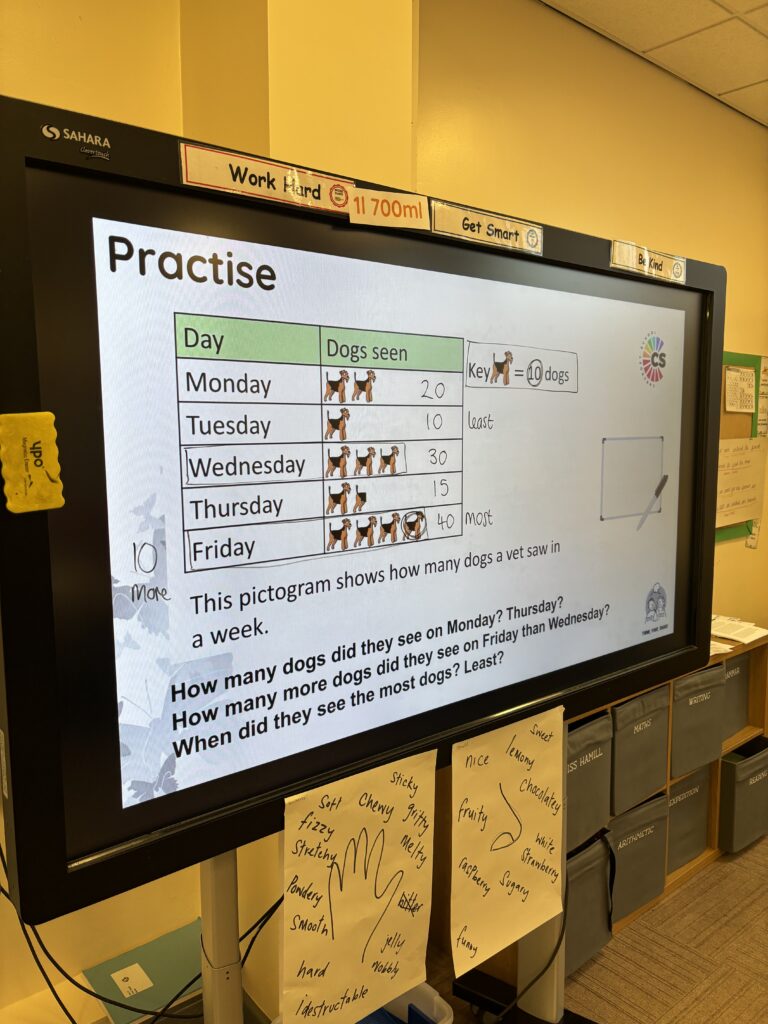
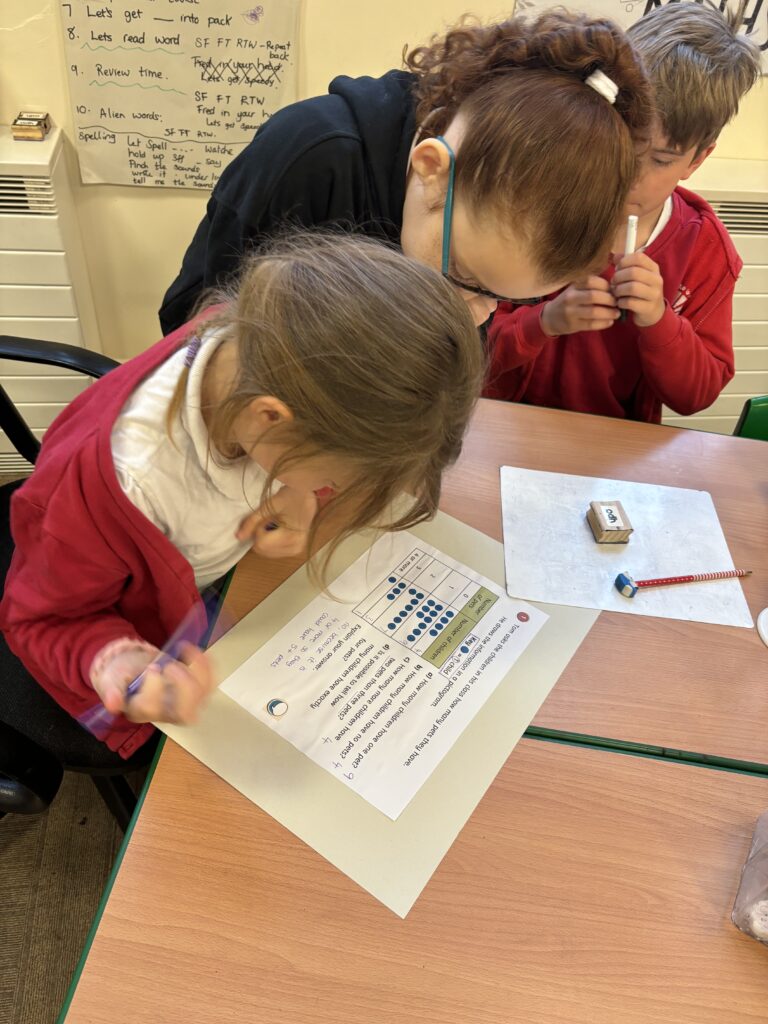
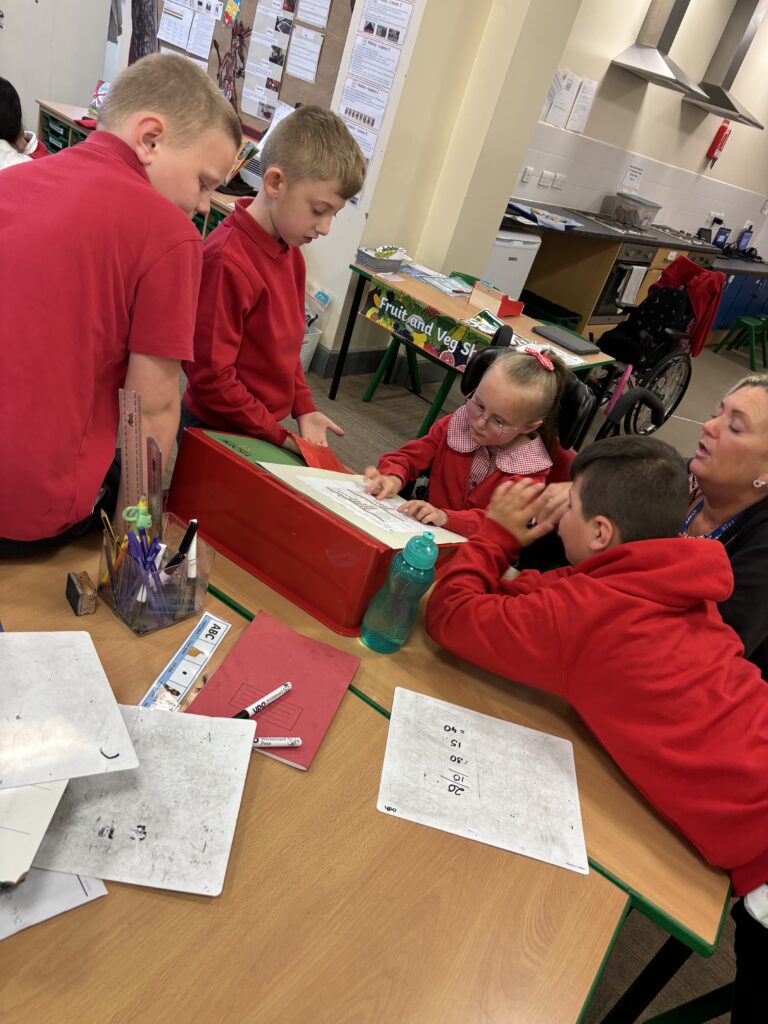
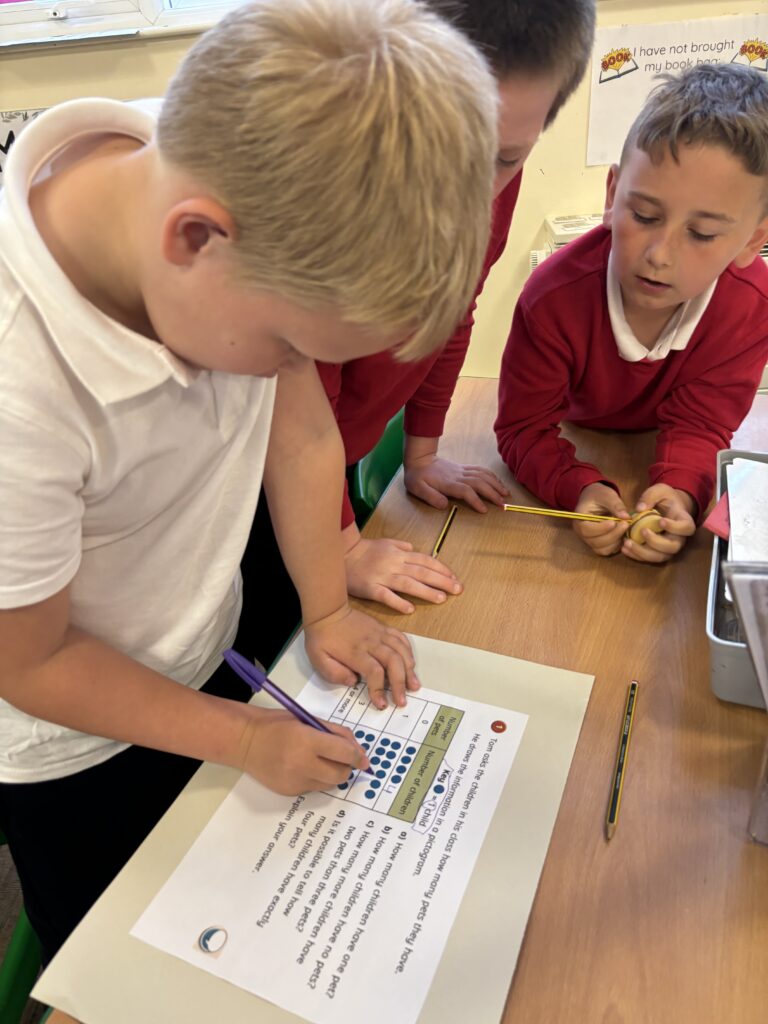
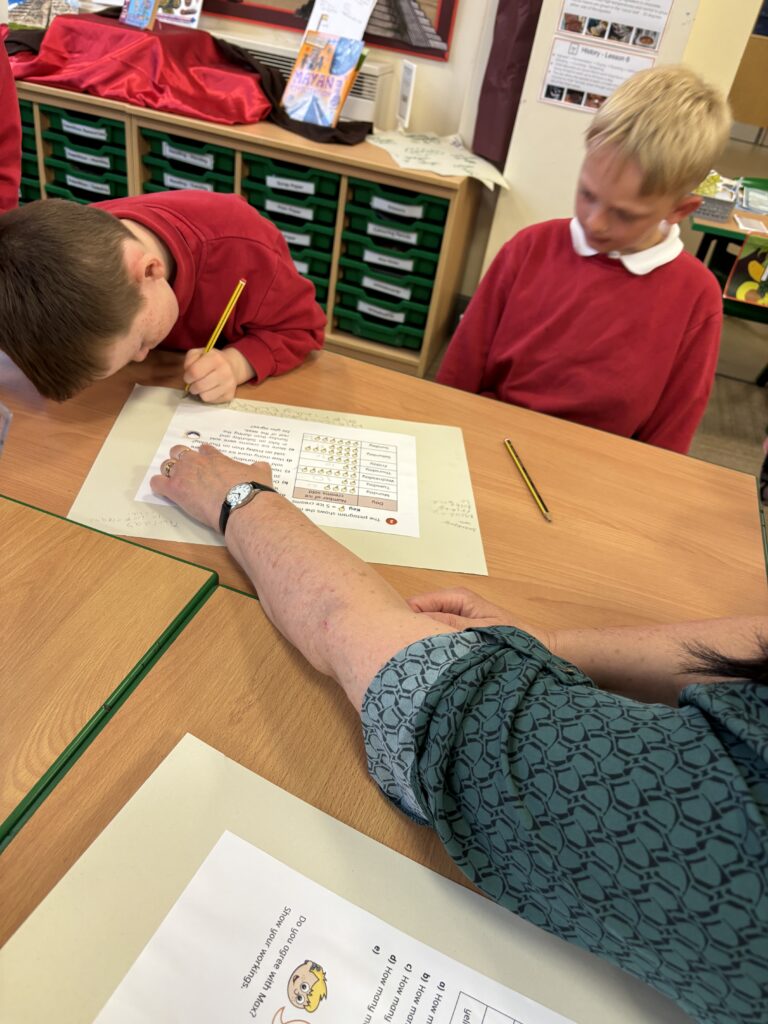
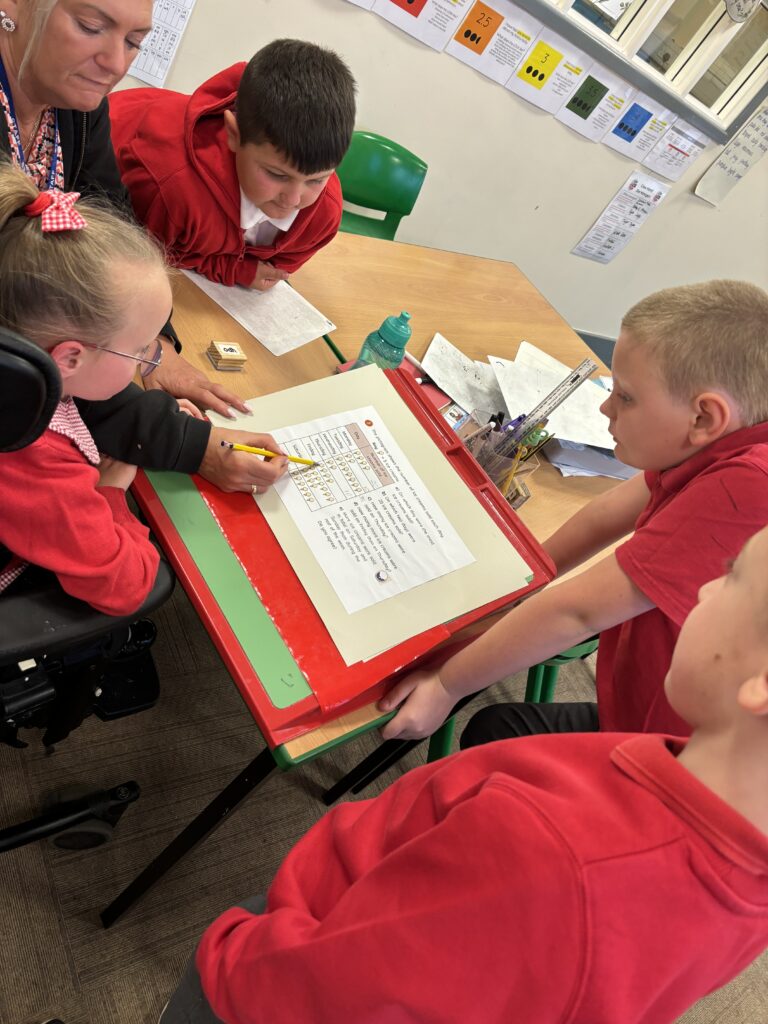
Today, Crew Hamill kickstarted their new maths unit – statistics – by interpreting pictograms. We first identified what a pictogram was and discussed how these are used to illustrate data. We worked as a crew to discuss a pictogram that detailed the number of animals a vet had seen during a week. We identified that a key shows what each of the pictures are worth within the table and then used this to answer a number of questions about it. Following this, we worked in mini crews to answer a range of questions about different pictograms, interpreting the data in front of us.