Today we consolidated our learning on digital time and pictograms in our do now activity then Interpreted bar charts in our main maths lesson 🙂
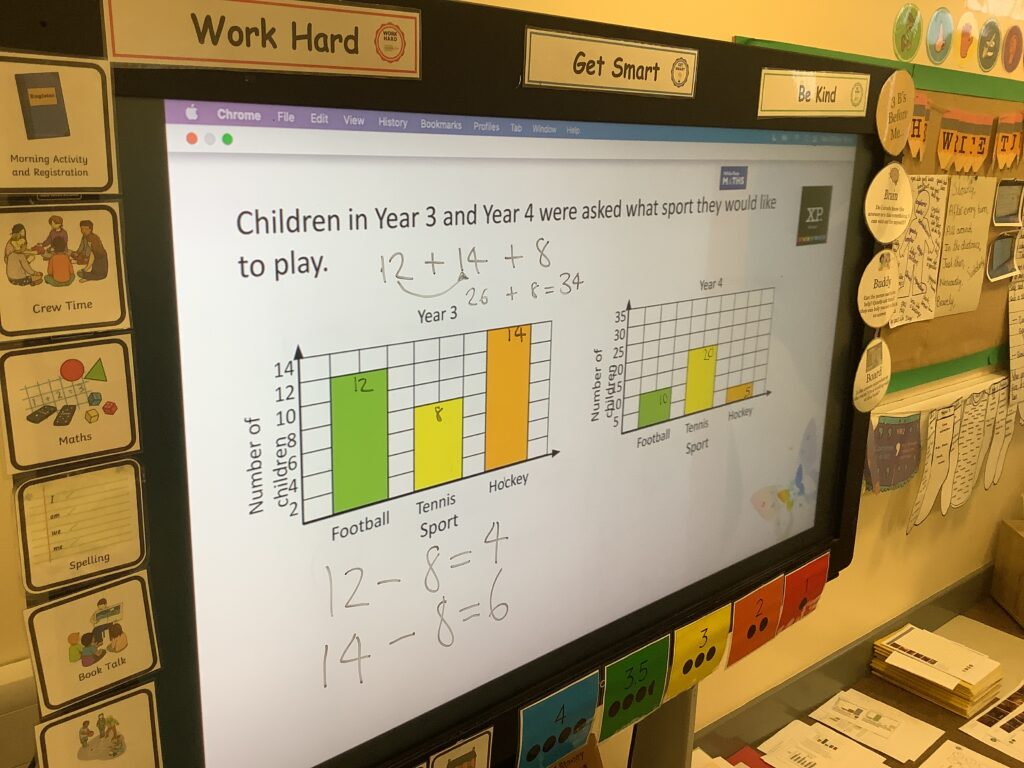
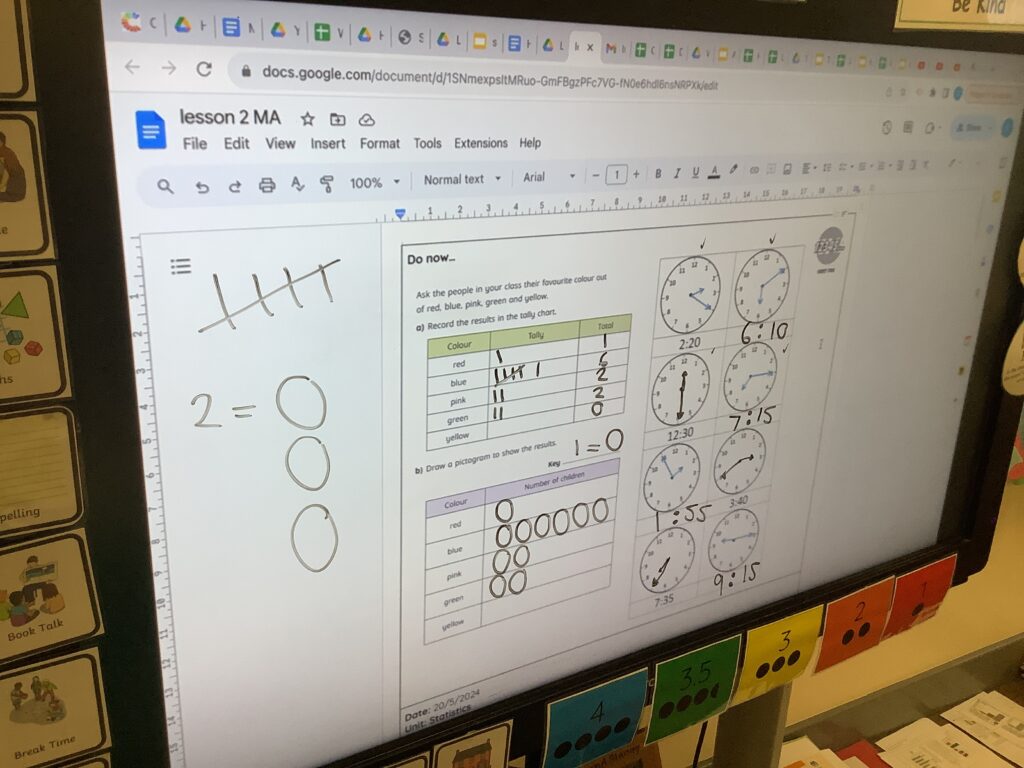
Today we consolidated our learning on digital time and pictograms in our do now activity then Interpreted bar charts in our main maths lesson 🙂