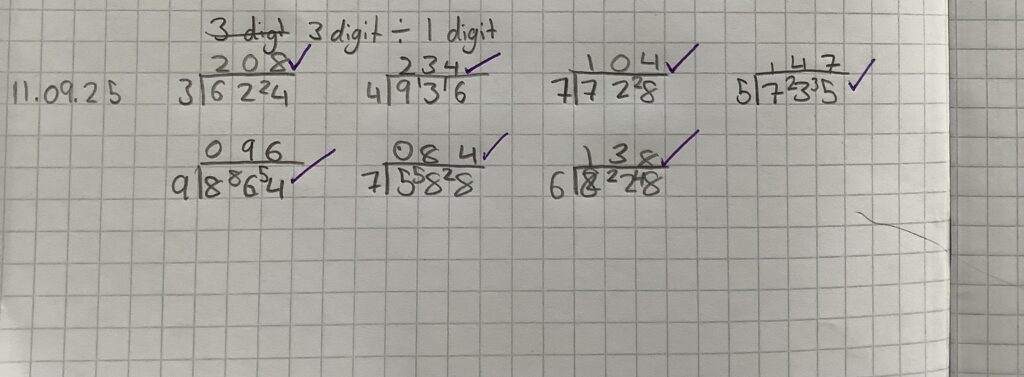
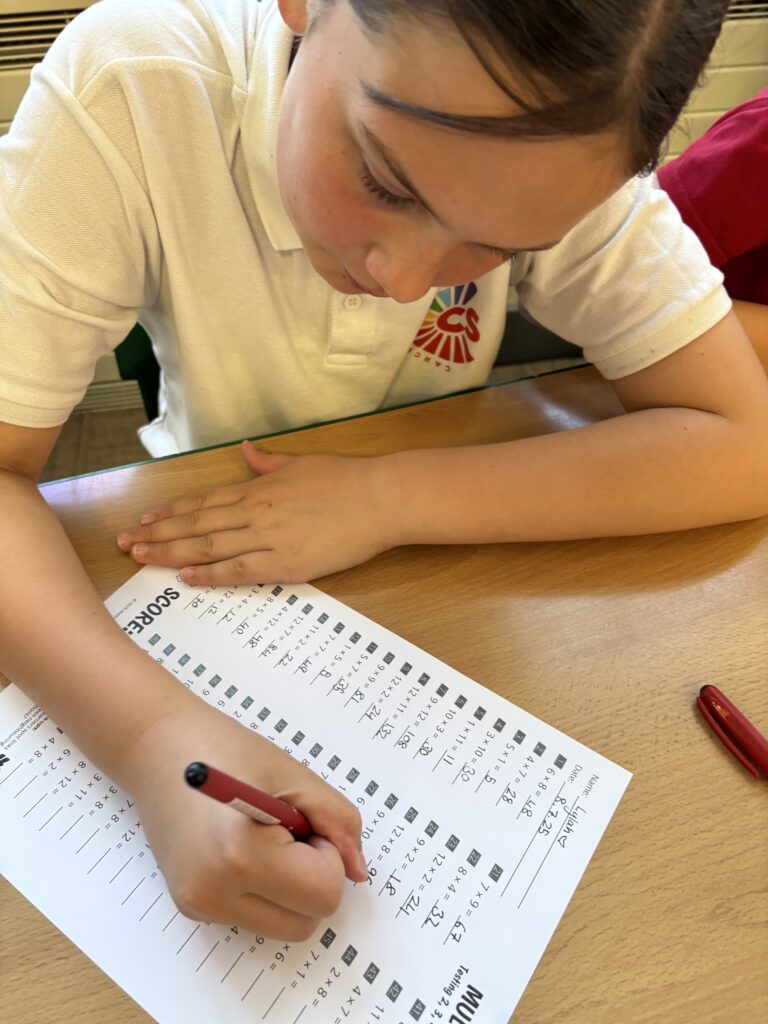
Crew Haddock did amazing in maths today. They all worked independently. Look at our work.

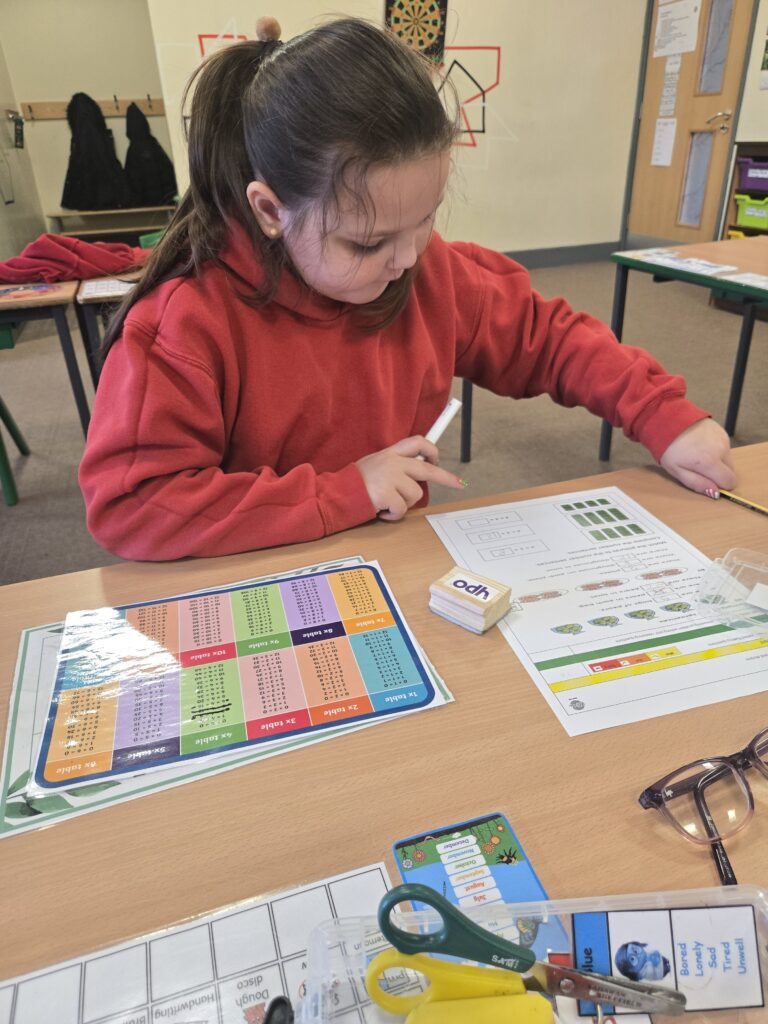
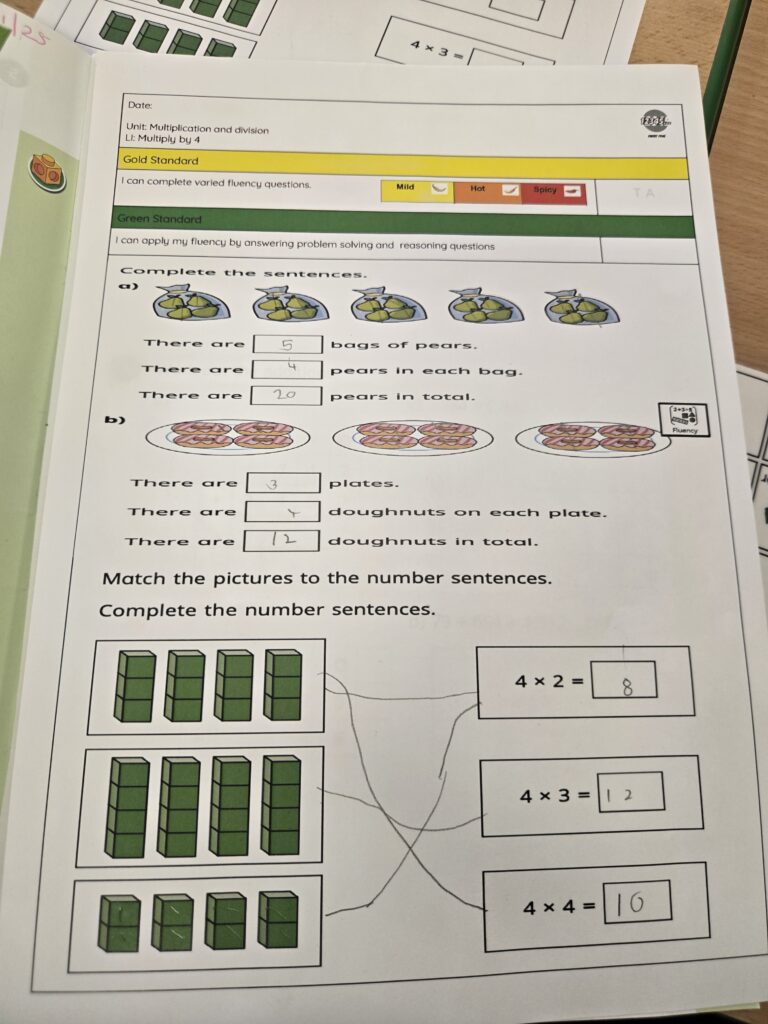

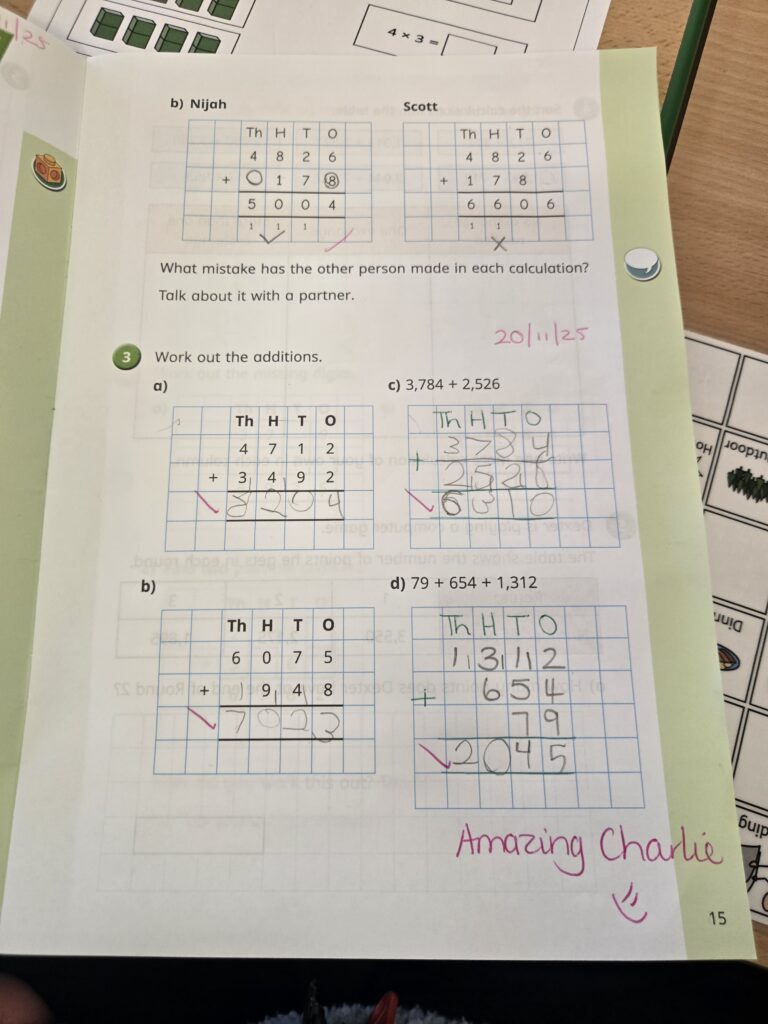
Crew Haddock did amazing in maths today. They all worked independently. Look at our work.
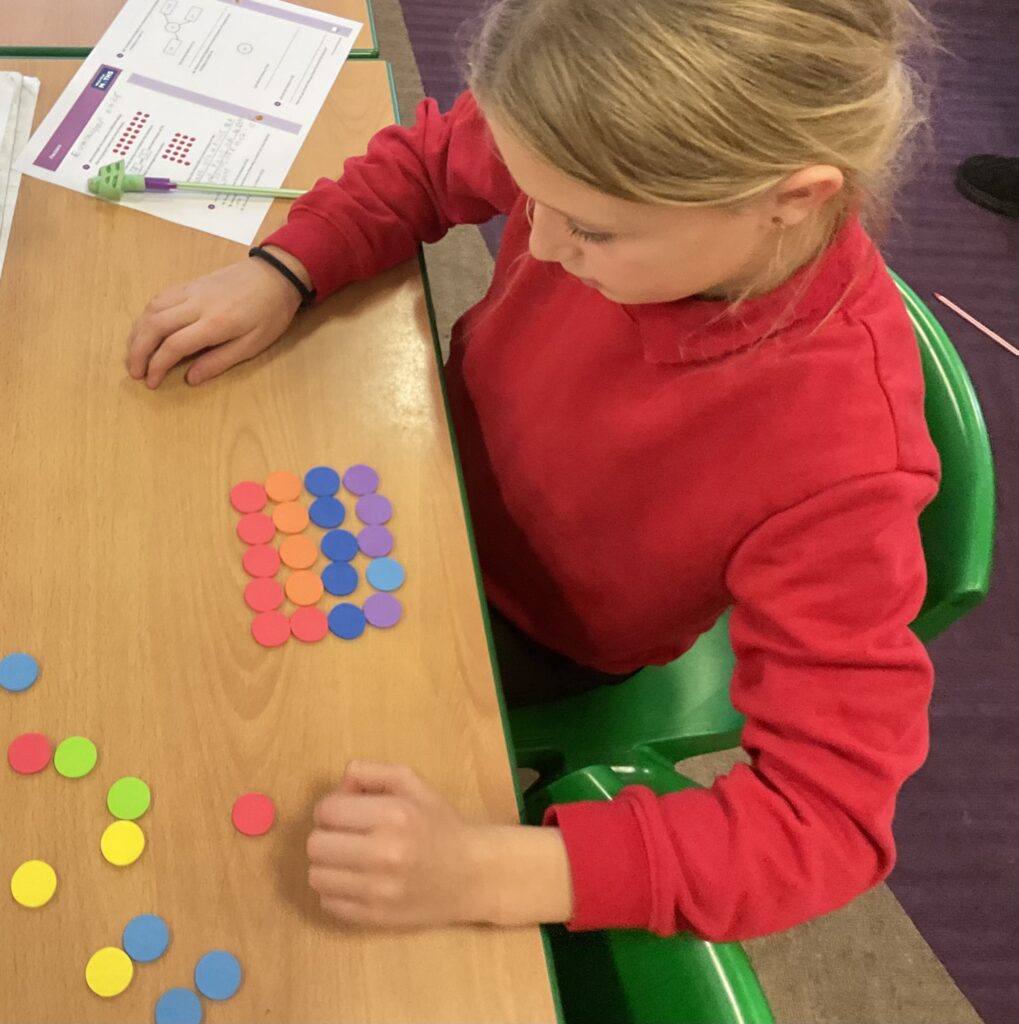
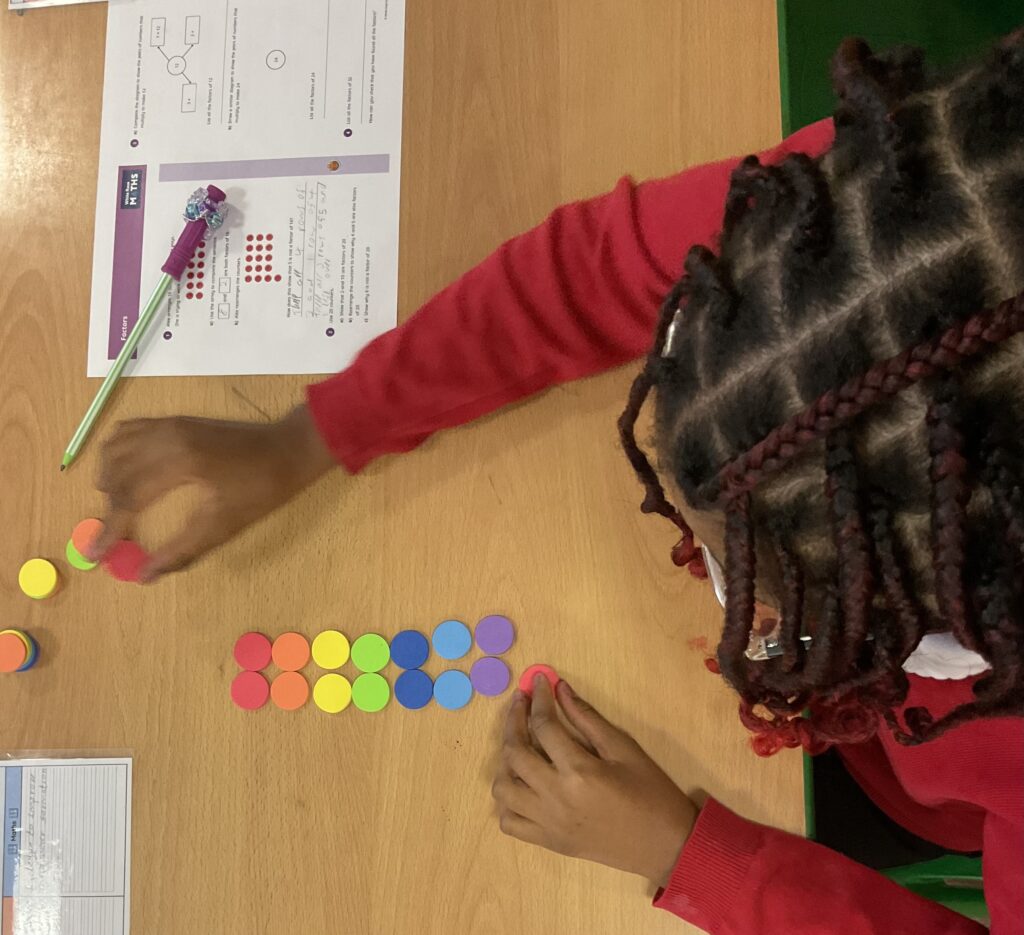
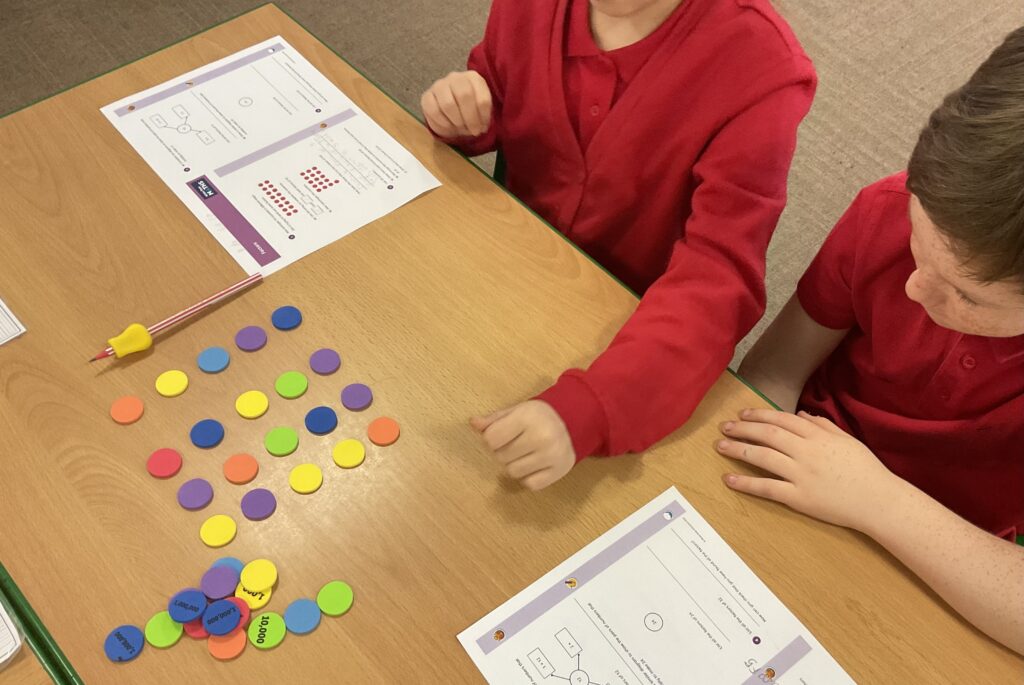
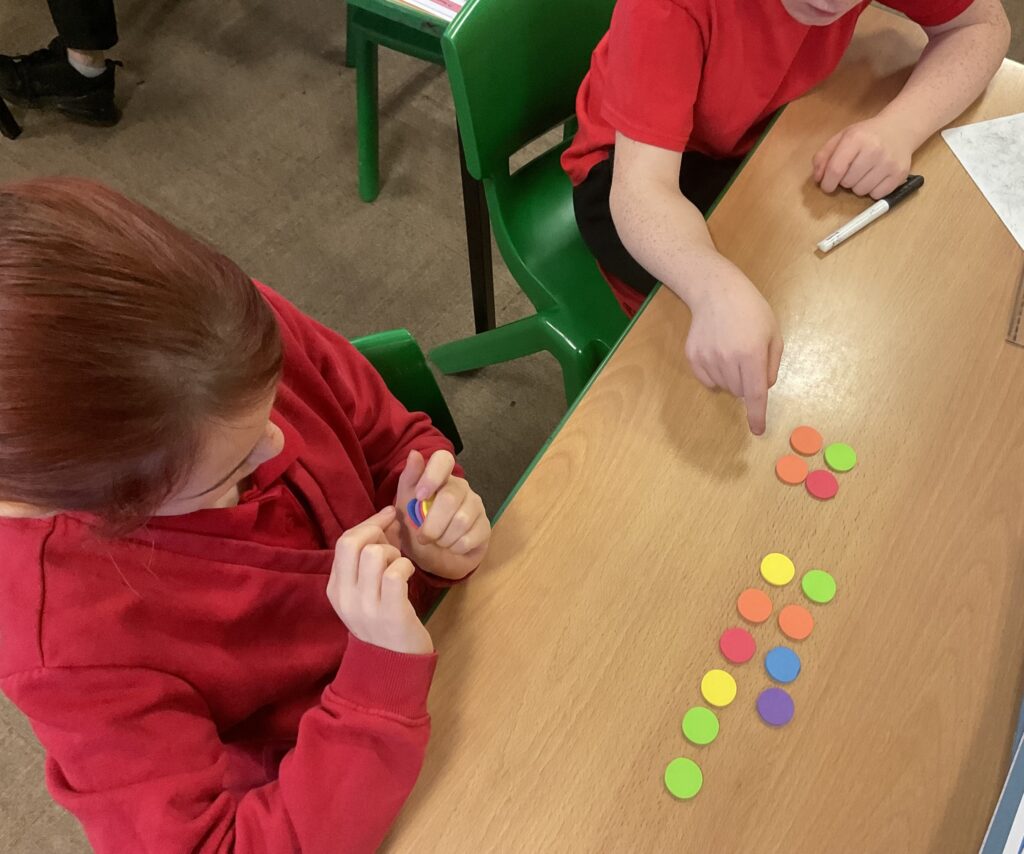
In Maths this week, Crew Gray have been using manipulatives in different ways to support our learning. We have found them to be really helpful when working out Factors and Square numbers.
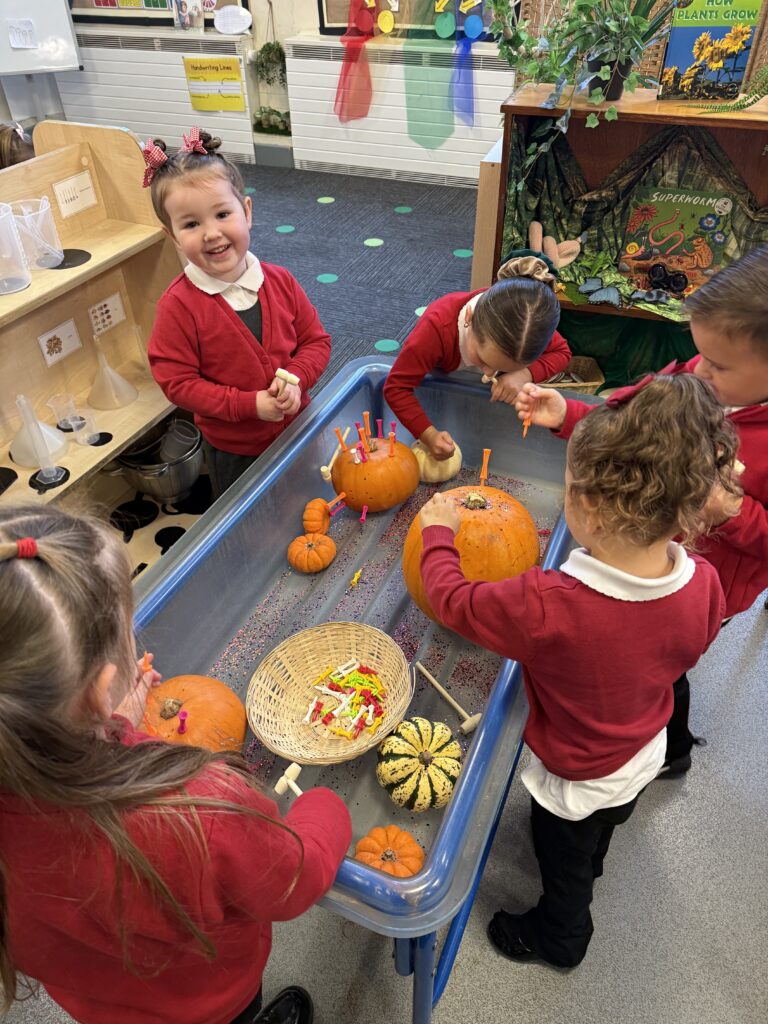
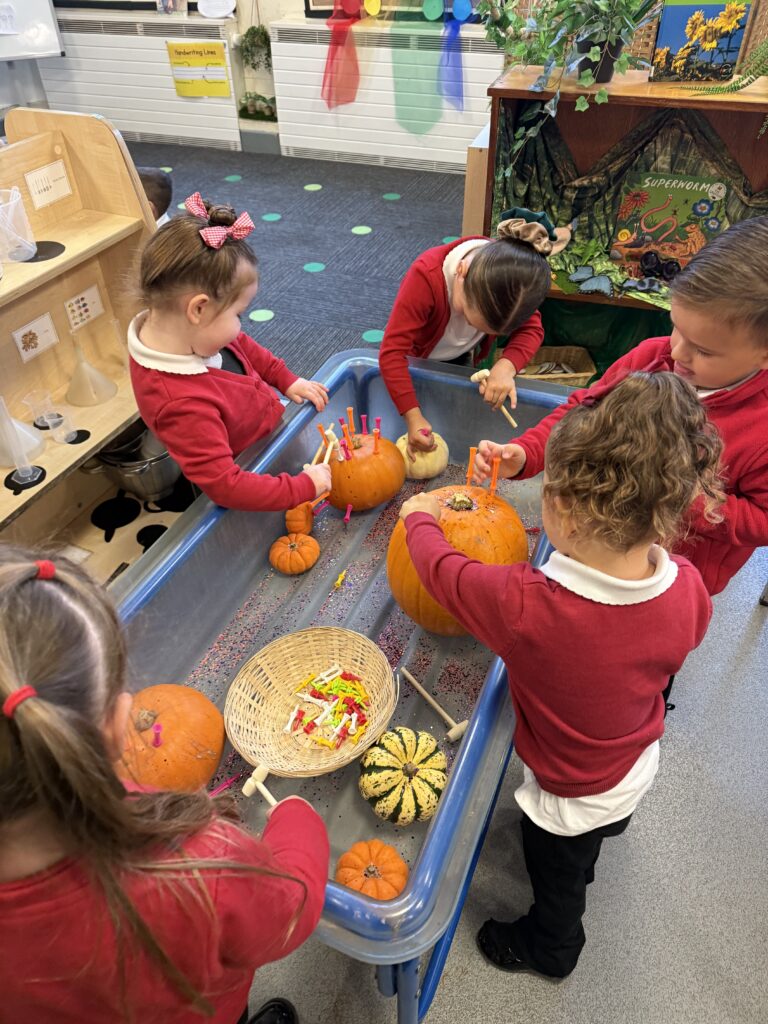
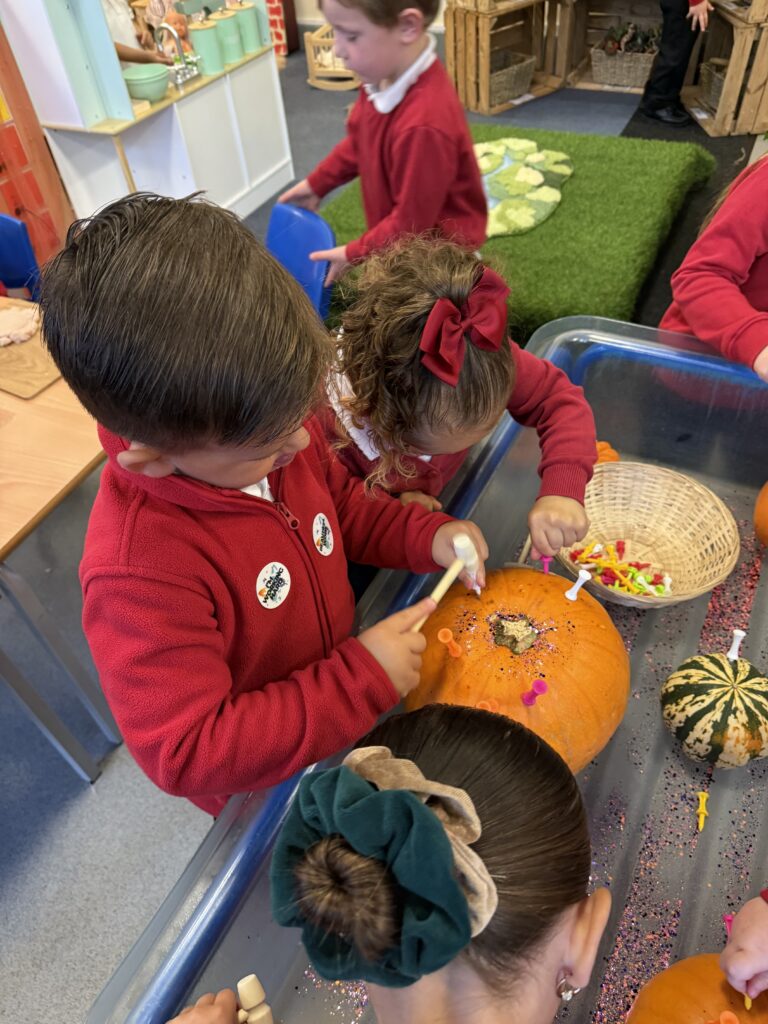
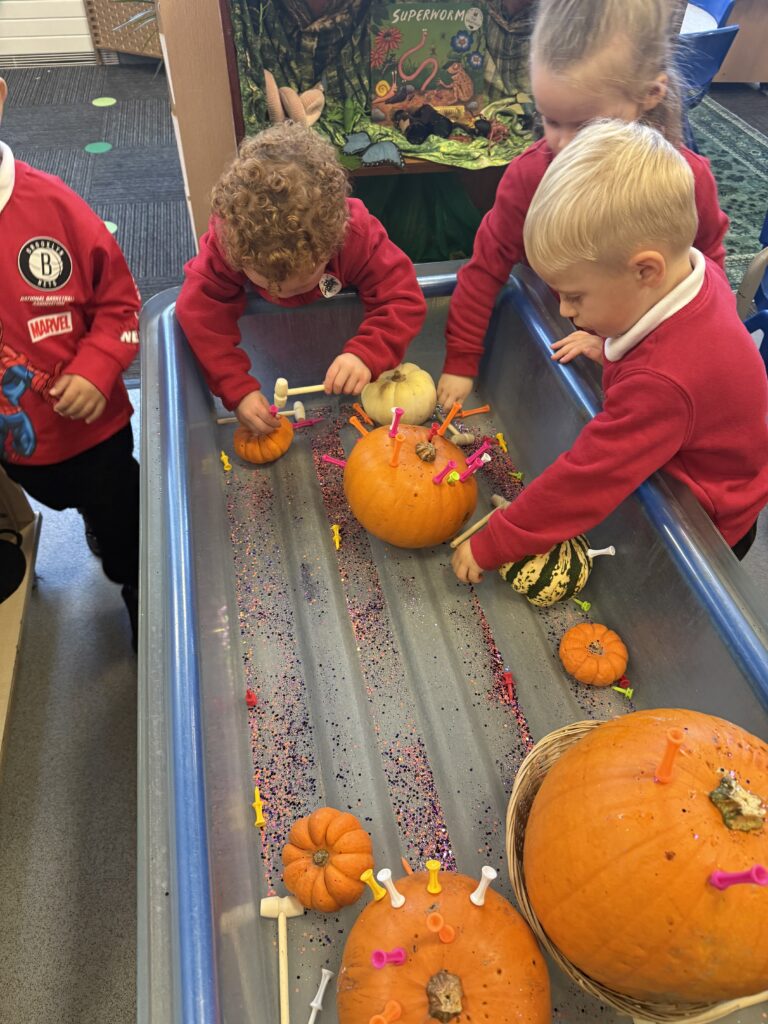
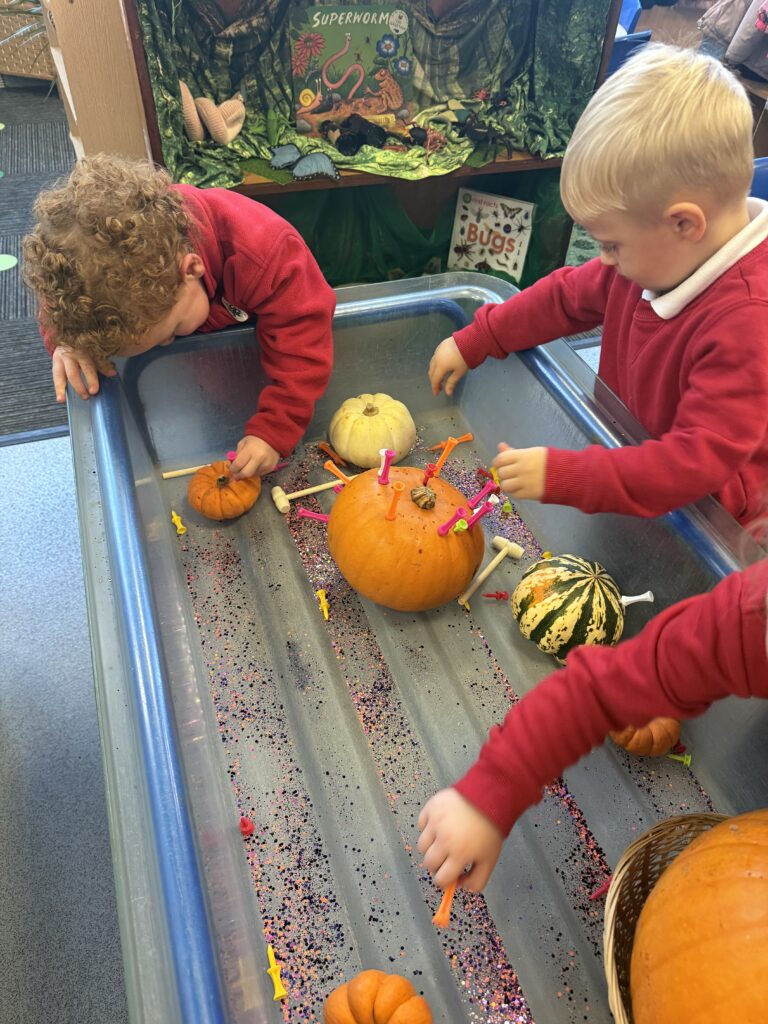
Crew Frost has had so much fun returning back this week! We have been learning all about autumn and the changes we see outside and the events we might celebrate. This week the children have enjoyed using pumpkins and colored golf pins to create their own patterns and arrangements, this really pushed our fine motor development by having to use hammers to secure our pins. We also enjoyed building our social and emotional skills by sharing with our friends and using our listening skills to recall how we use the tools safely.


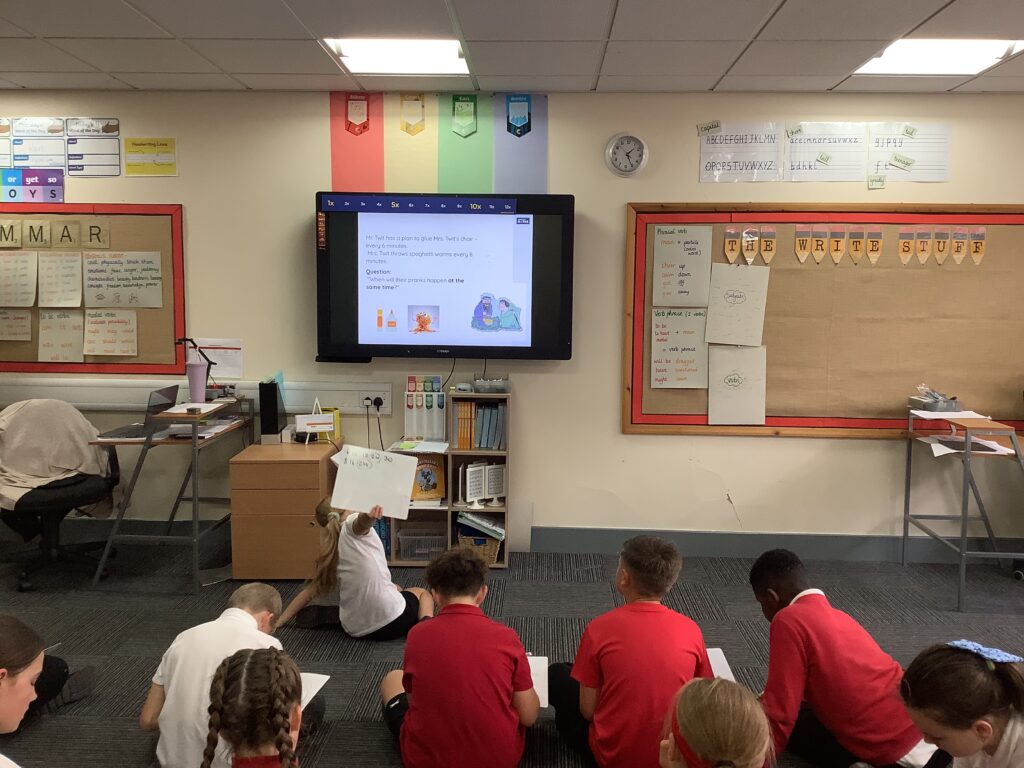
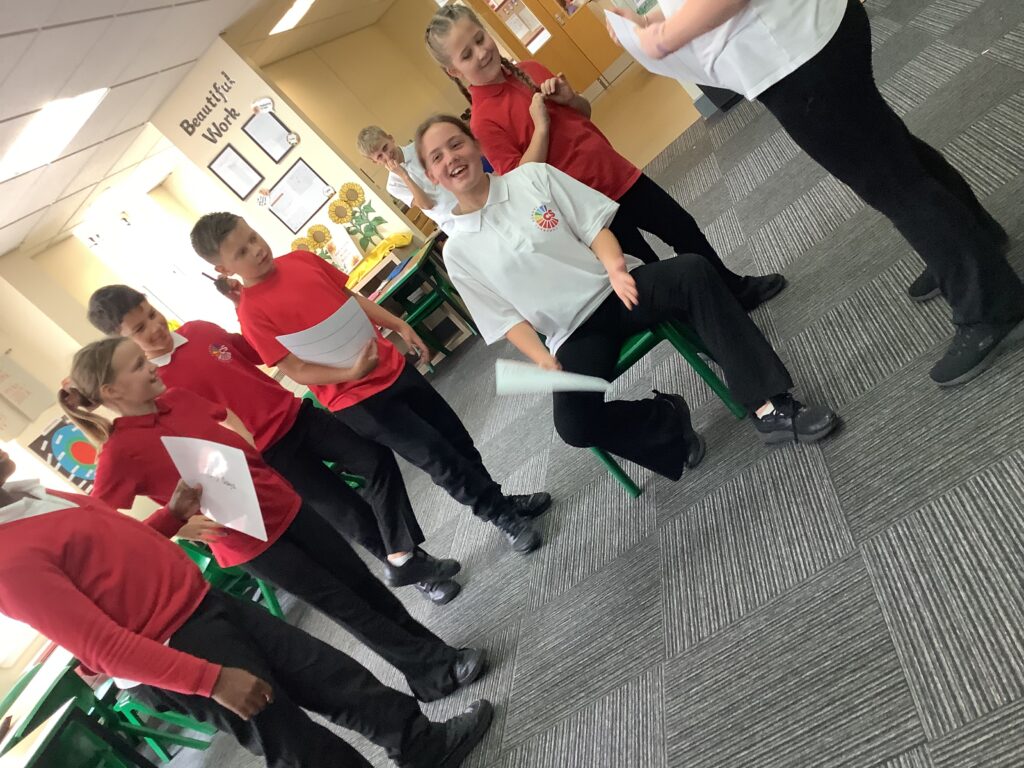
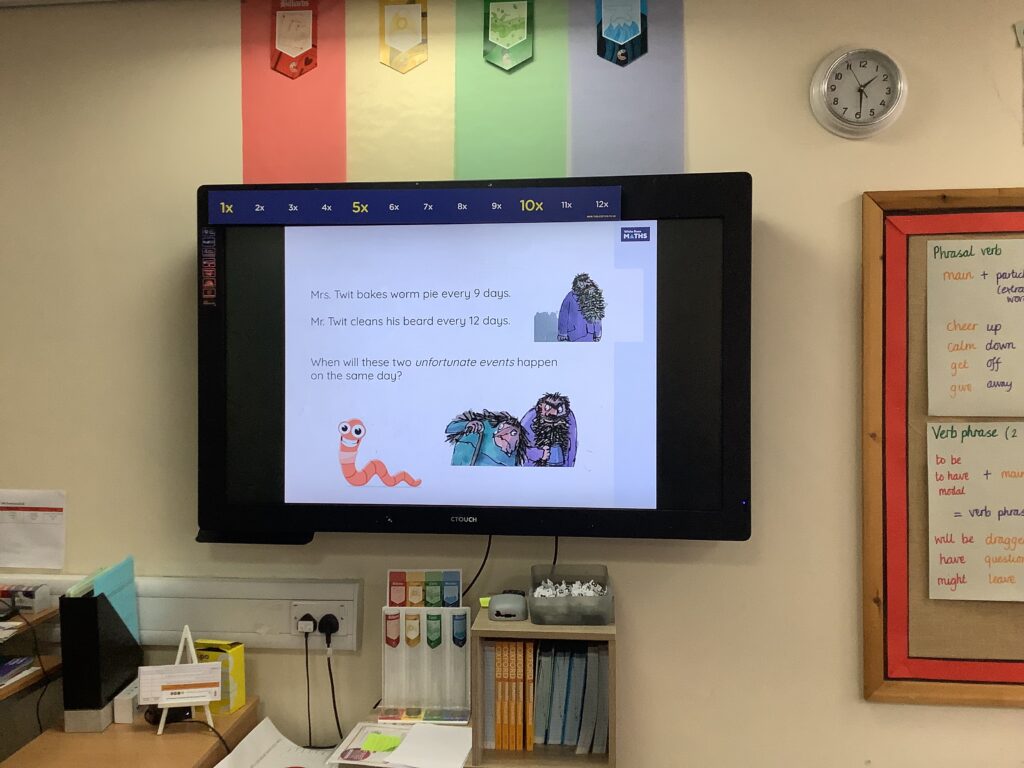
We had so much fun immersing ourselves in all things Roald Dahl. Our lessons were themed around his books, and one of our favourites was the The Twits arithmetic challenge!
We worked in teams to solve tricky riddles based on Mr. and Mrs. Twit’s silly pranks. To crack the codes, we had to use our knowledge of common multiples – it made maths even more exciting!
It was a brilliant way to learn while exploring the weird and wonderful world of Roald Dahl.
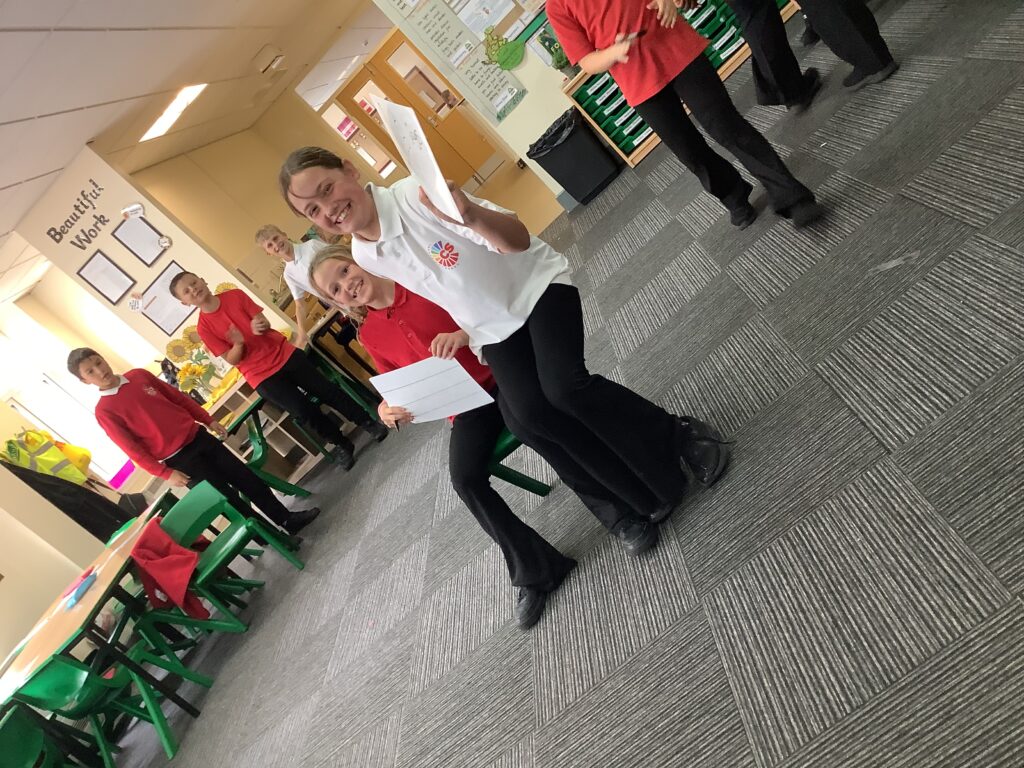
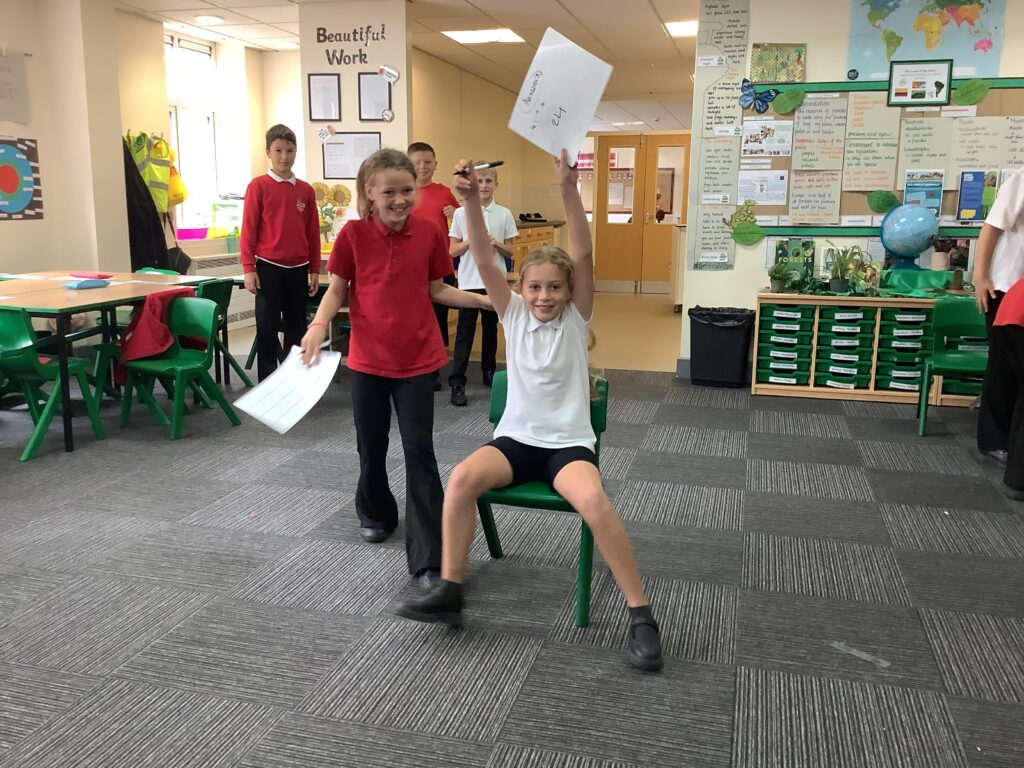
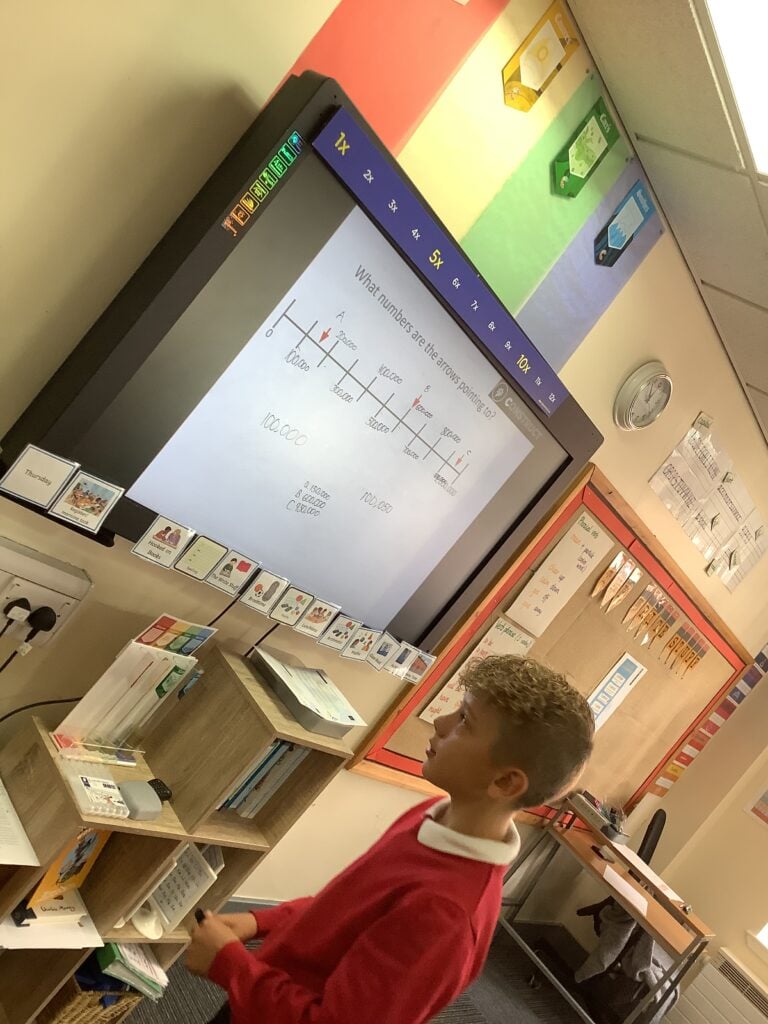
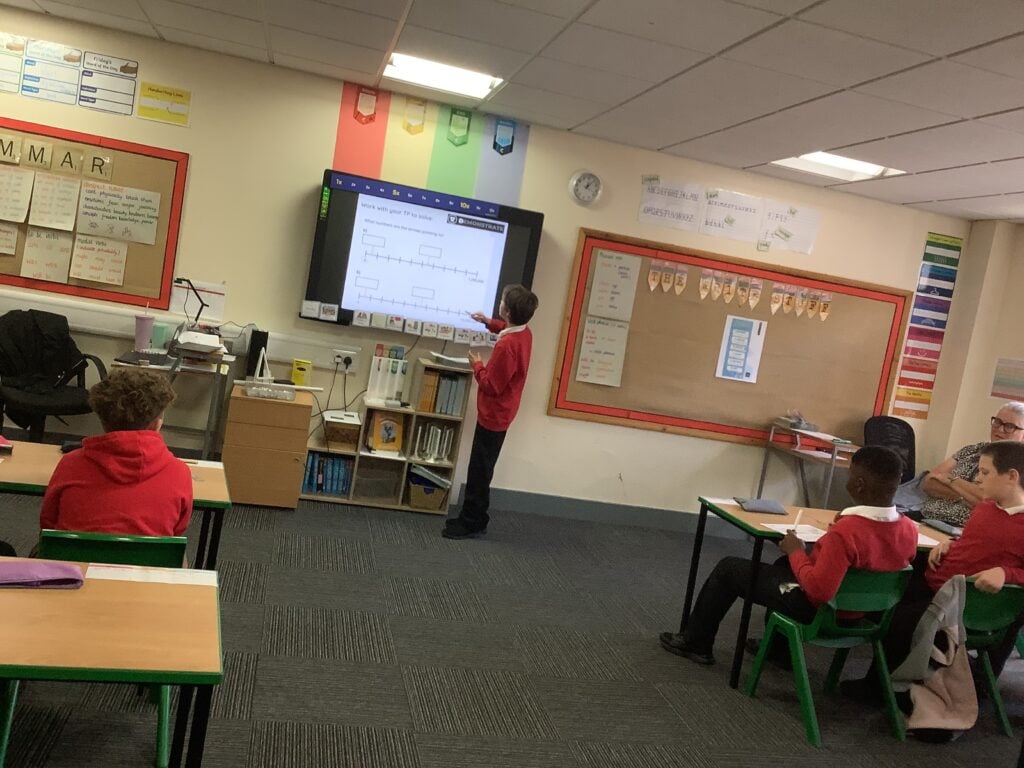
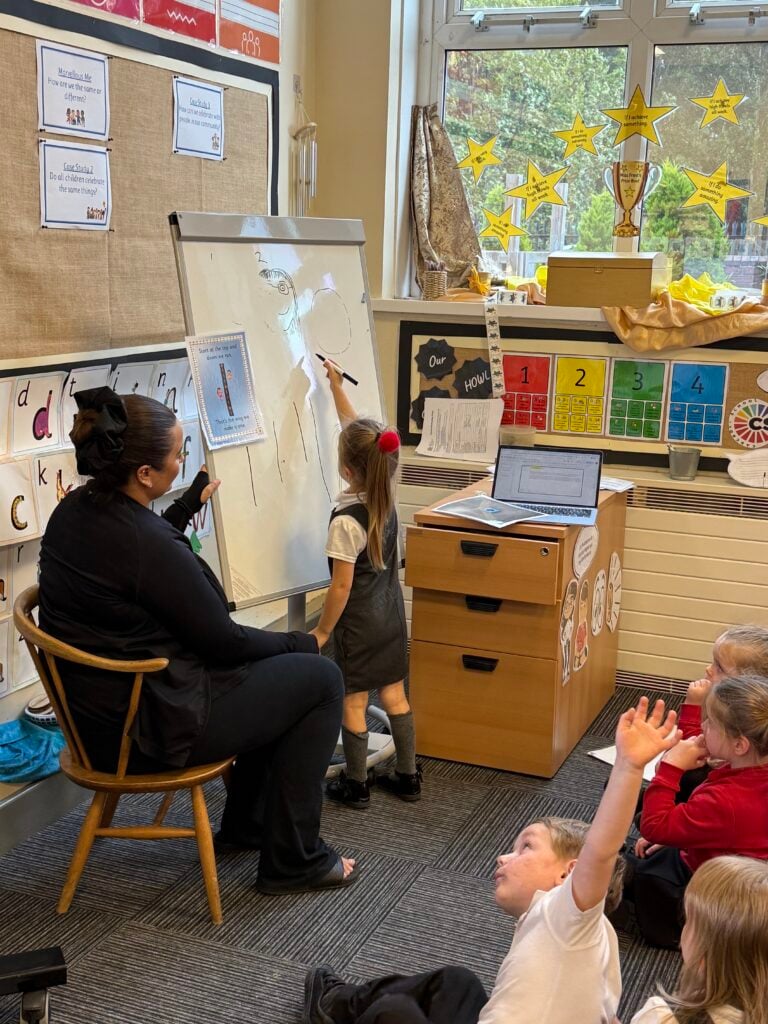
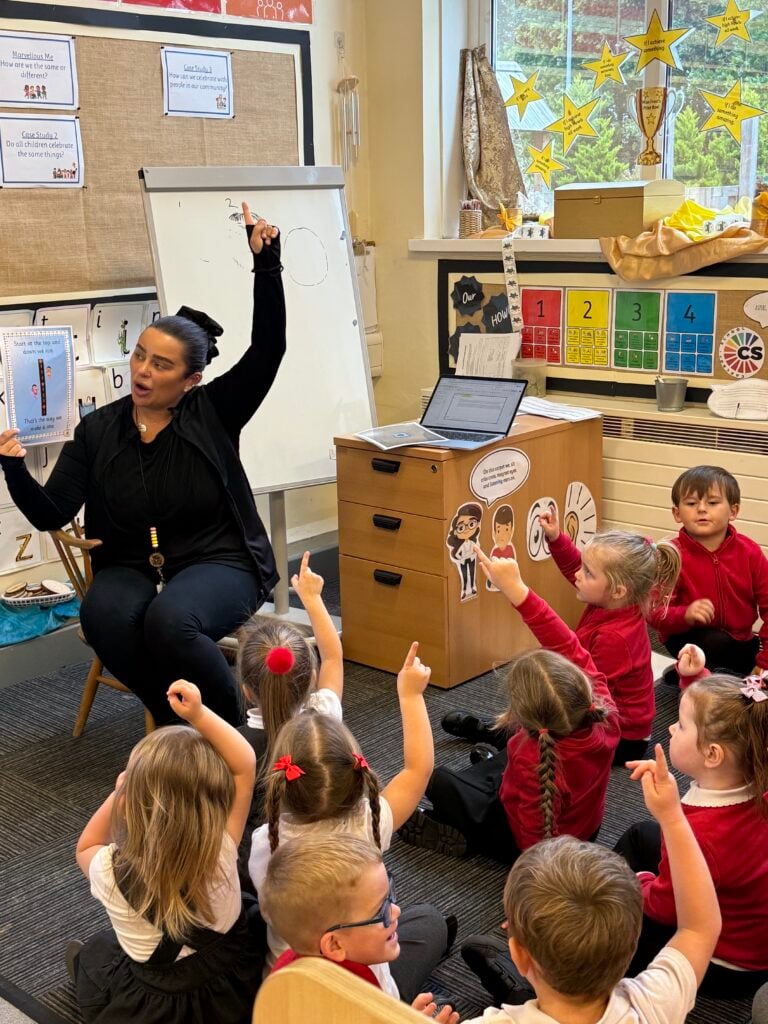
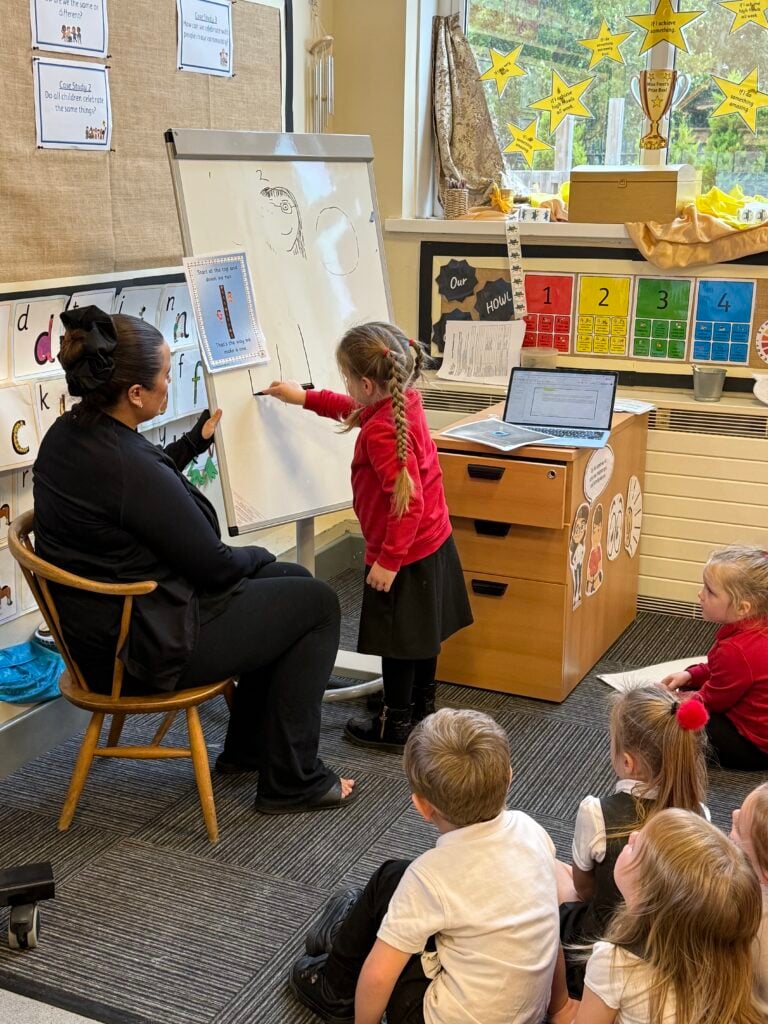
This week in Crew Rankin, we have taken control of our own learning!
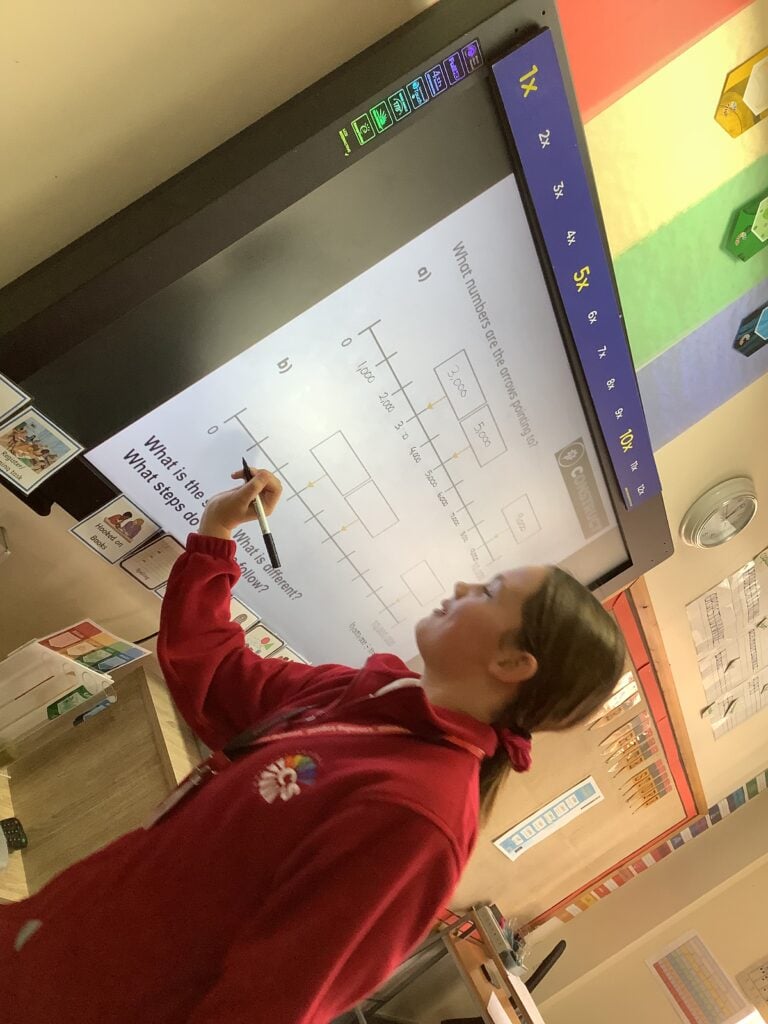
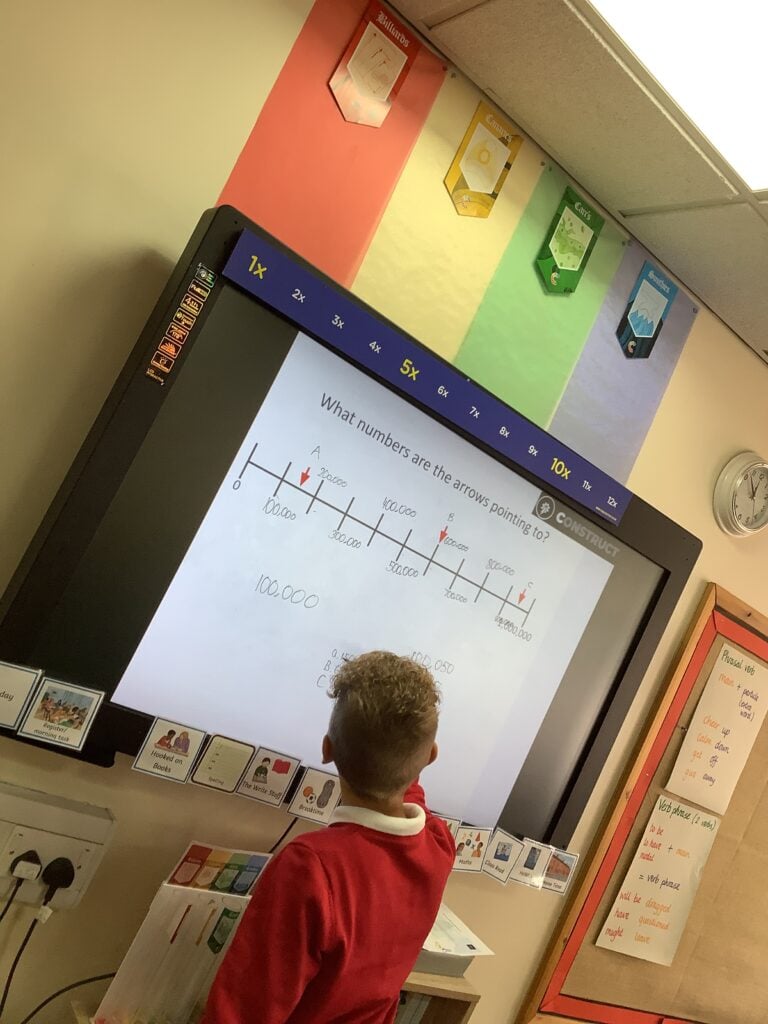
We’ve been stepping up to the board during Maths, explaining our thinking, and helping each other understand new ideas. It felt a bit strange at first, but was really empowering too.
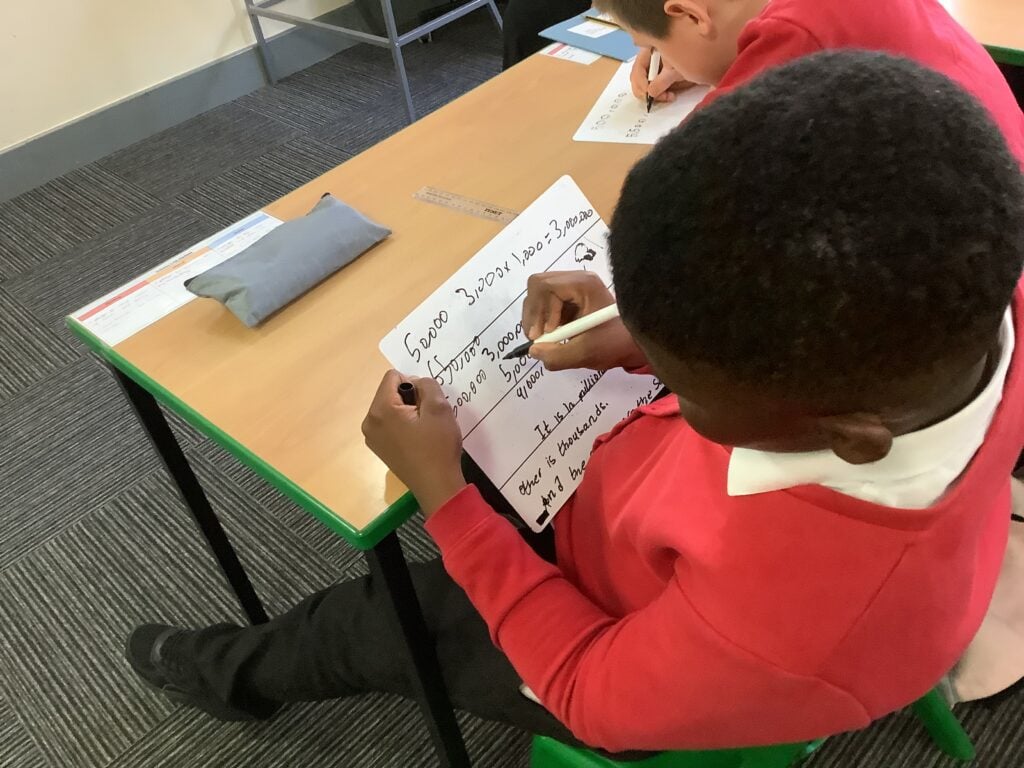
Taking charge like this has helped us grow more confident, not just in what we know, but in how we share it. When we teach our classmates, we realise how much we’ve actually learned – and sometimes, we find new ways of thinking about things together as a crew.
We’ve really enjoyed this experience. It’s made our crew stronger and we now know that everyone has something valuable to offer.
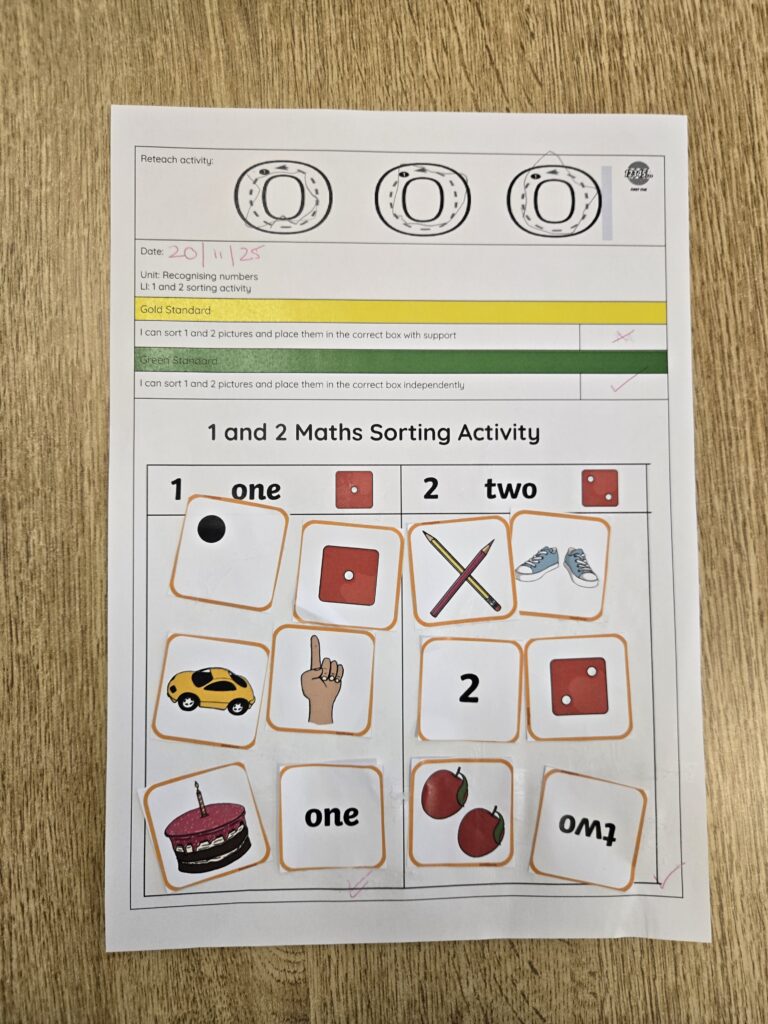
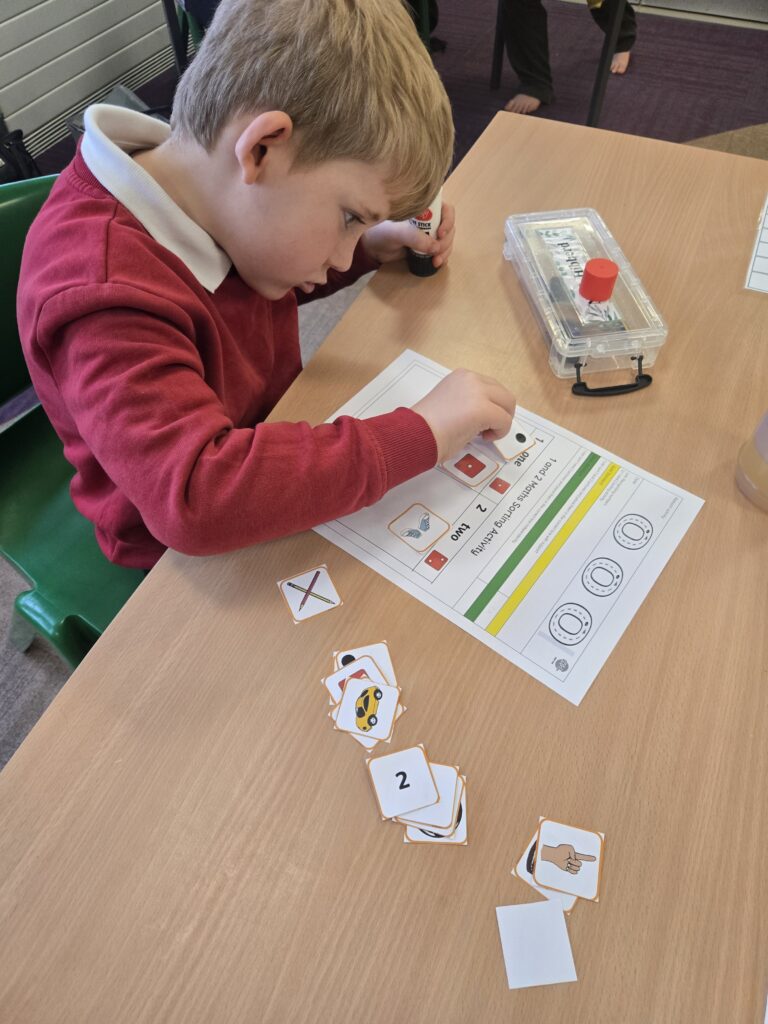
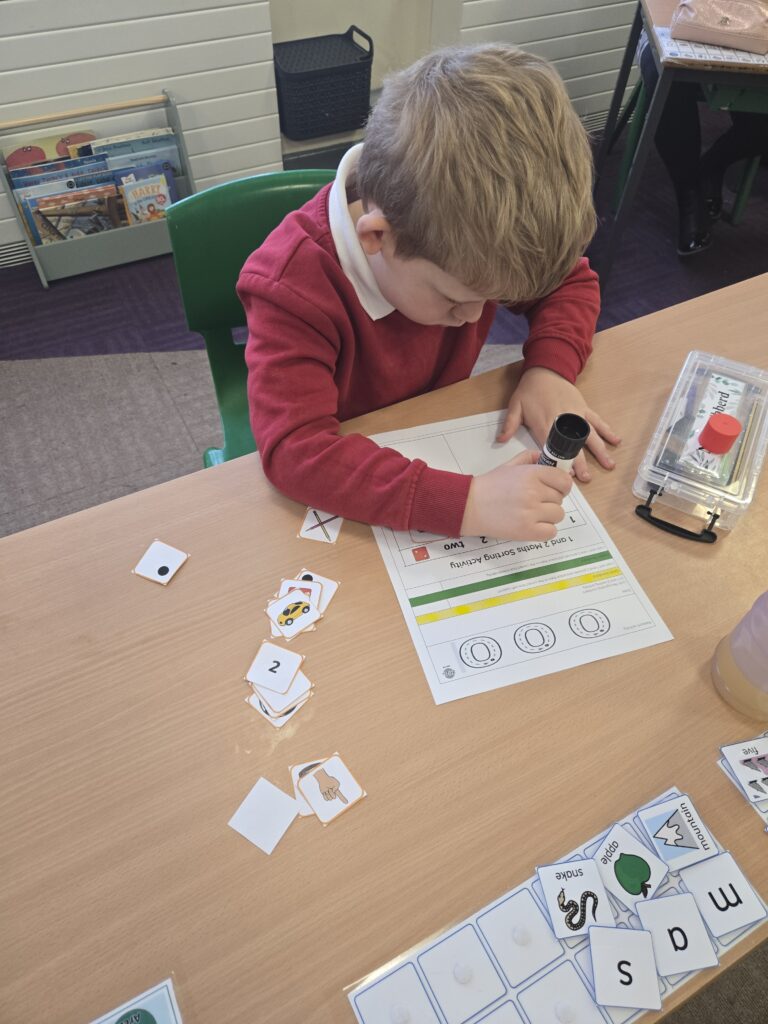
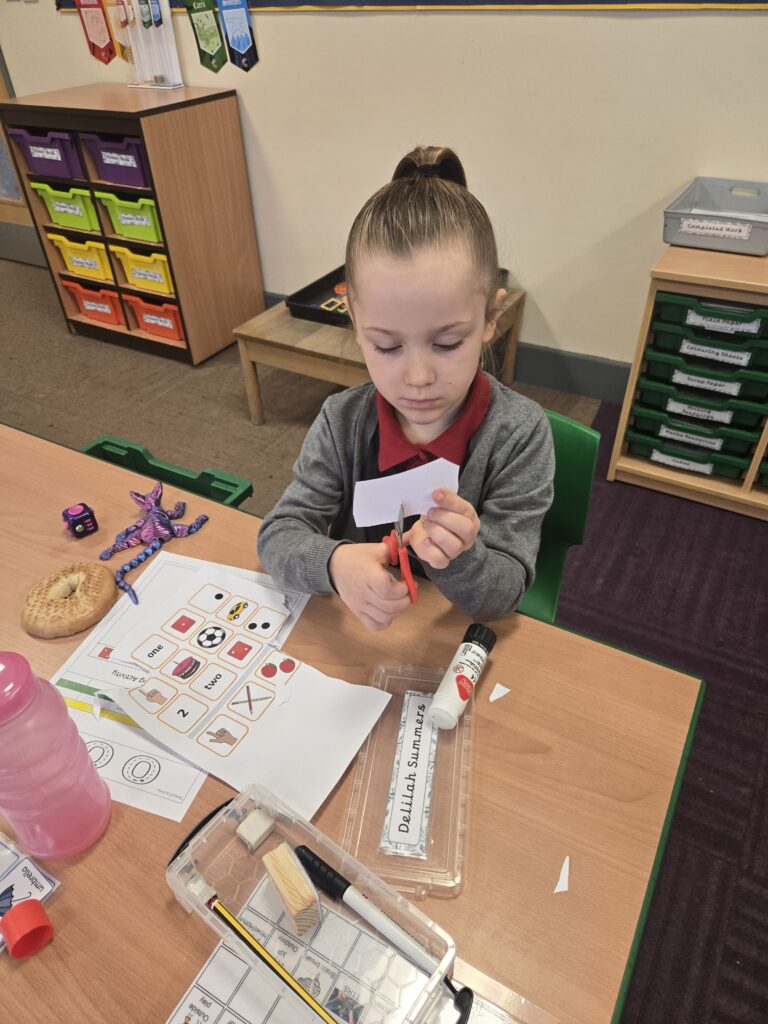
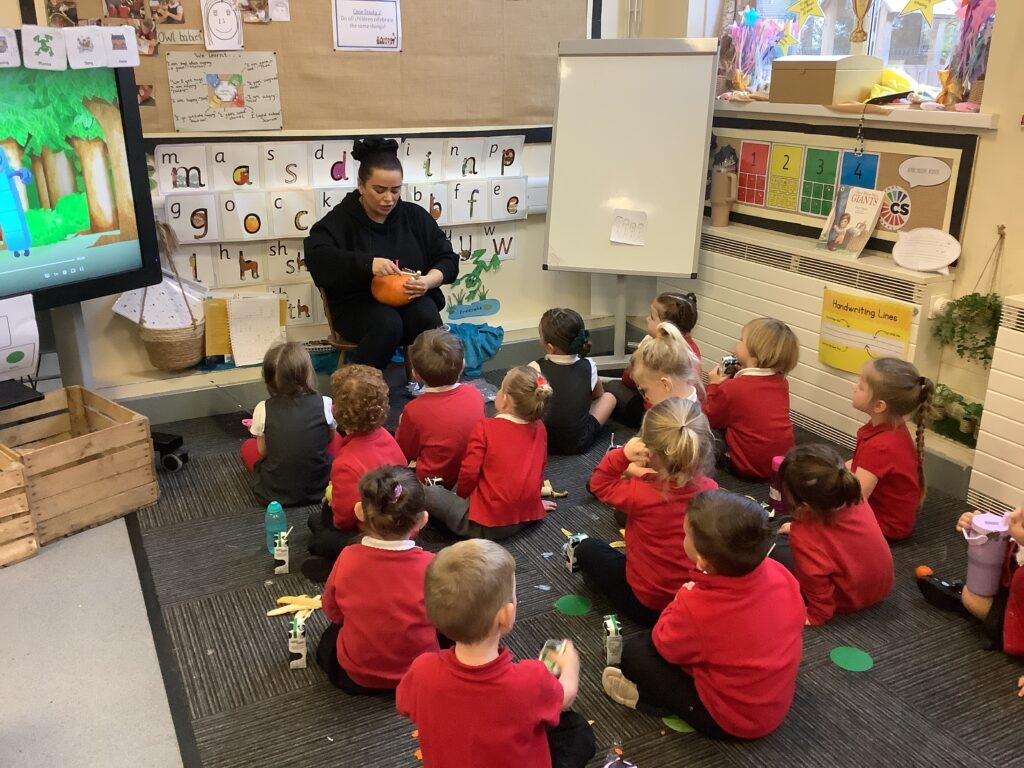
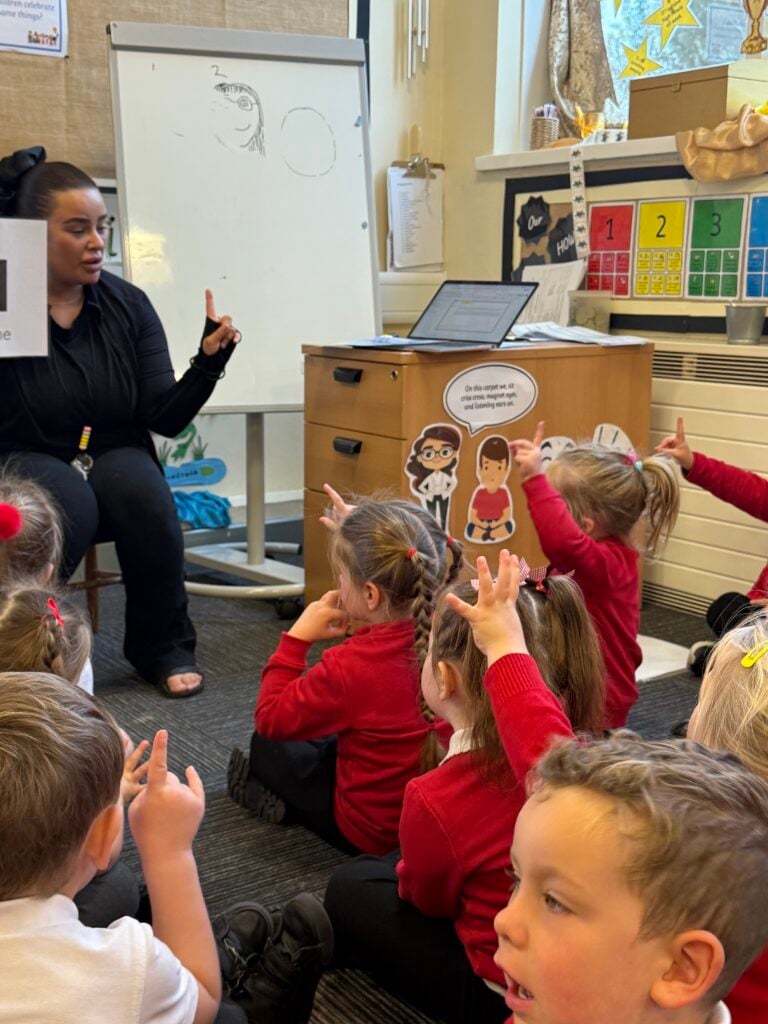
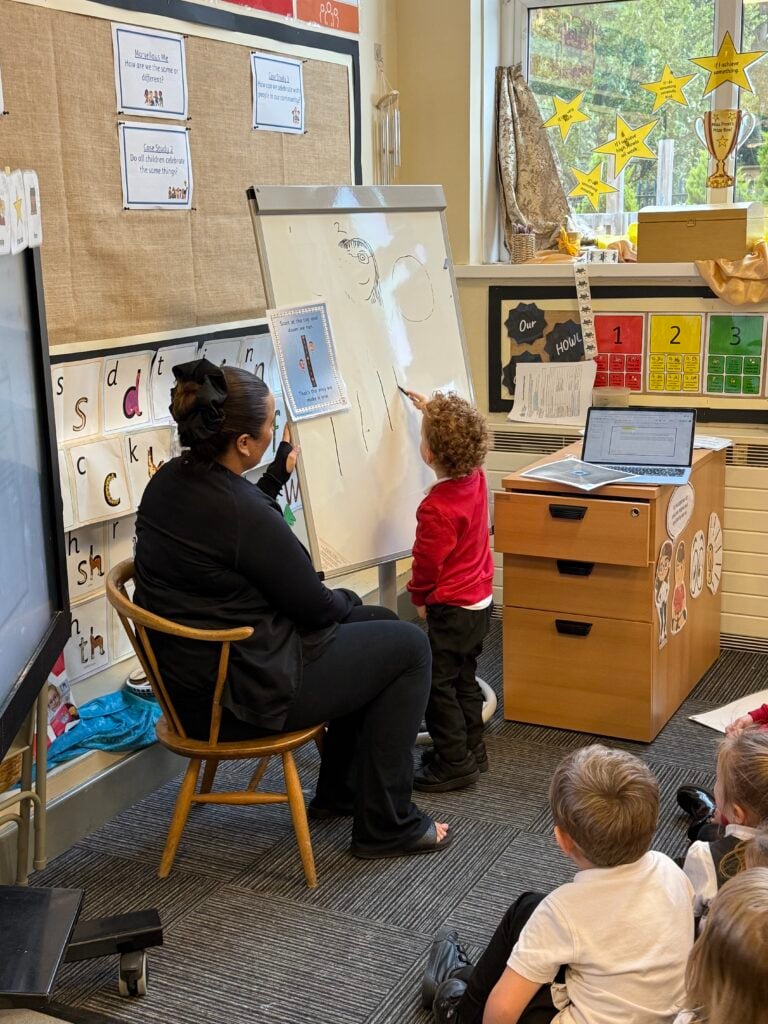
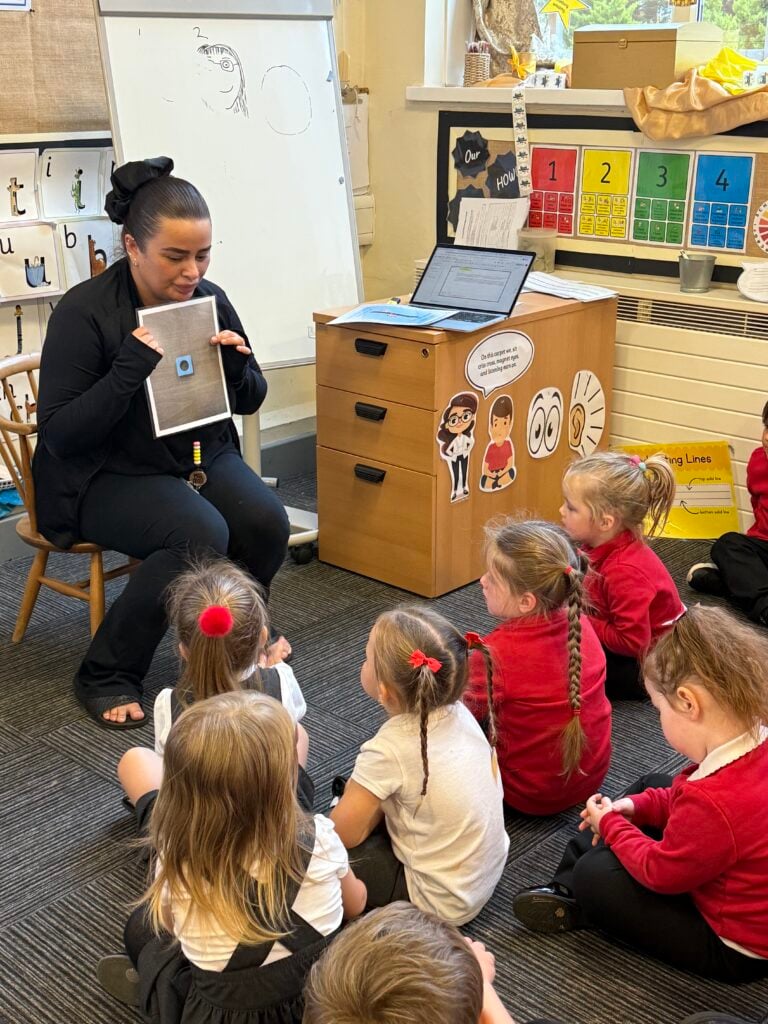
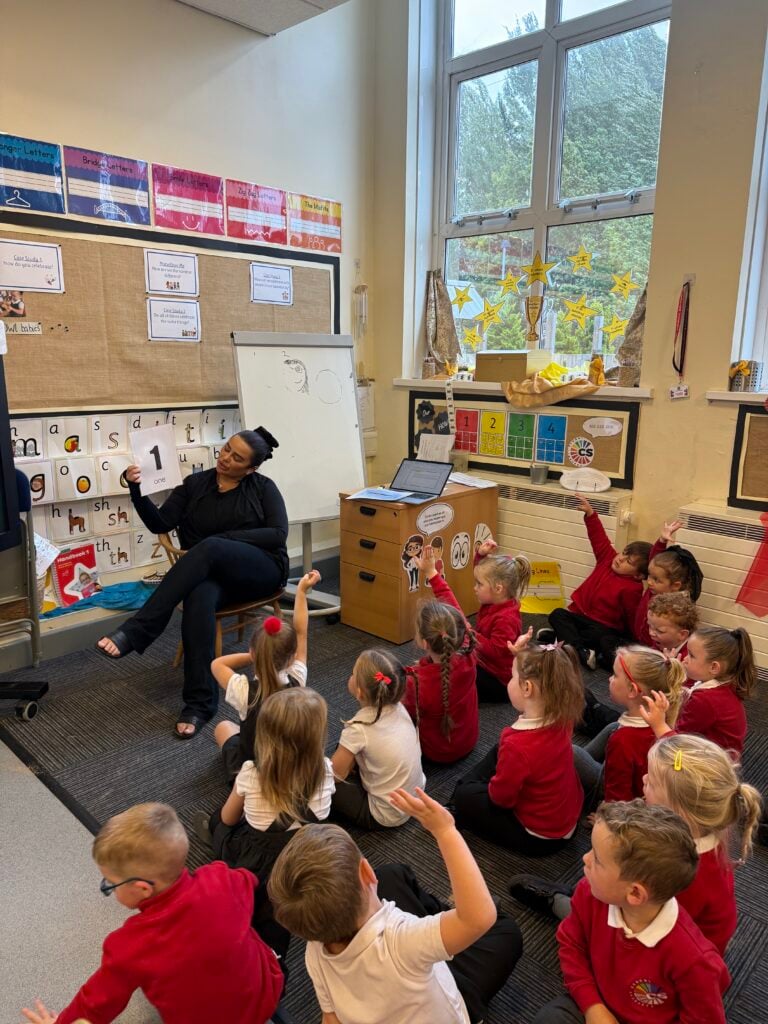
This week the children have begun maths! In our first session we are focusing on the number 1, here we have learnt how to say it, write it, and show it! Well done Crew Frost we cannot wait to subtilize next using our fast maths eyes!
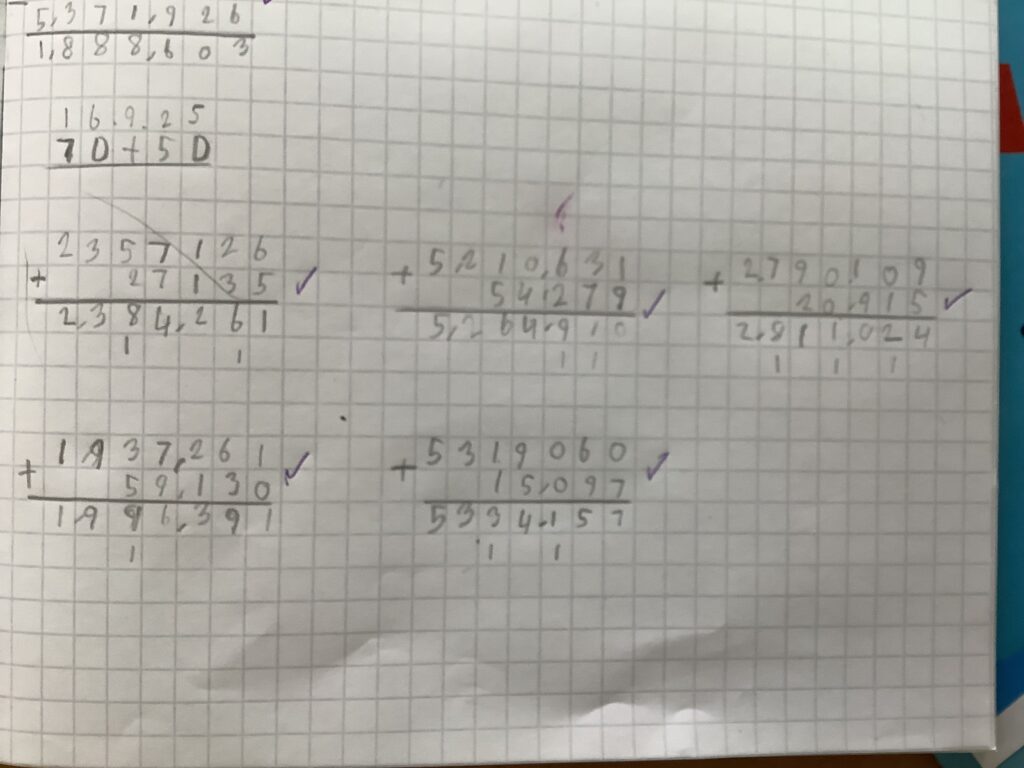
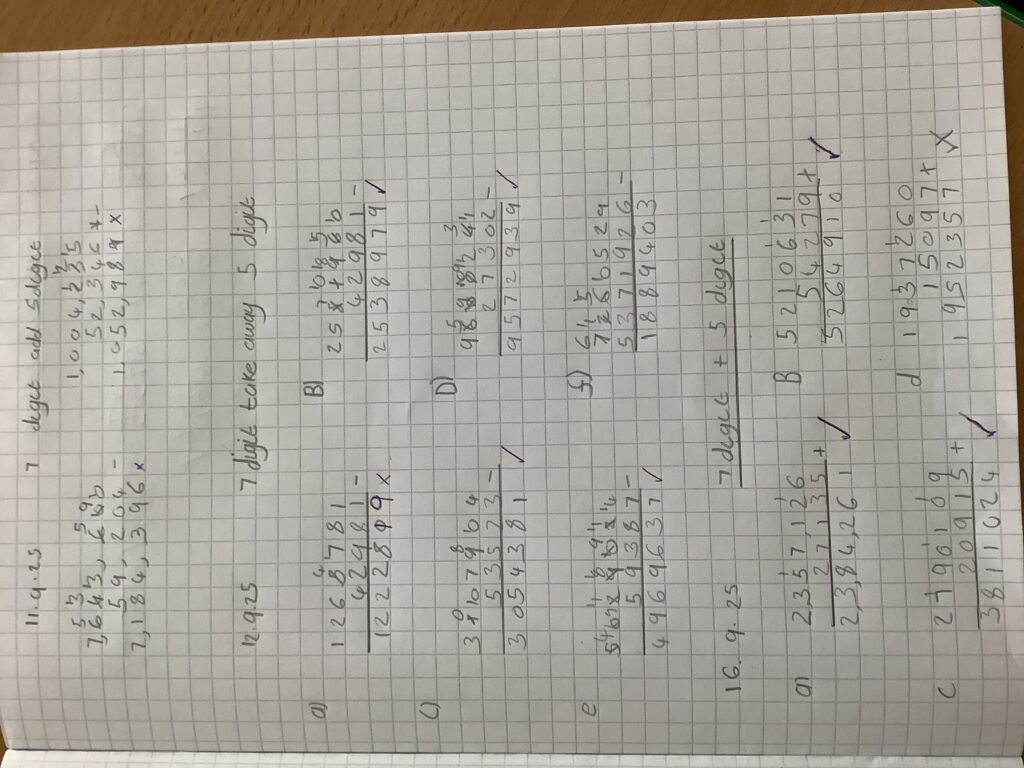
This week in Year 6, we’ve been working extra hard in our afternoon maths intervention sessions. In our groups, we’ve been focusing really well and challenging ourselves with tricky problems.
It hasn’t always been easy, but we’ve shown lots of resilience and kept going even when things felt tough. We’re really proud of how much progress we’re making and how well we’ve supported each other along the way.
Maths can be challenging, but with determination, we’ve proved we can do it!
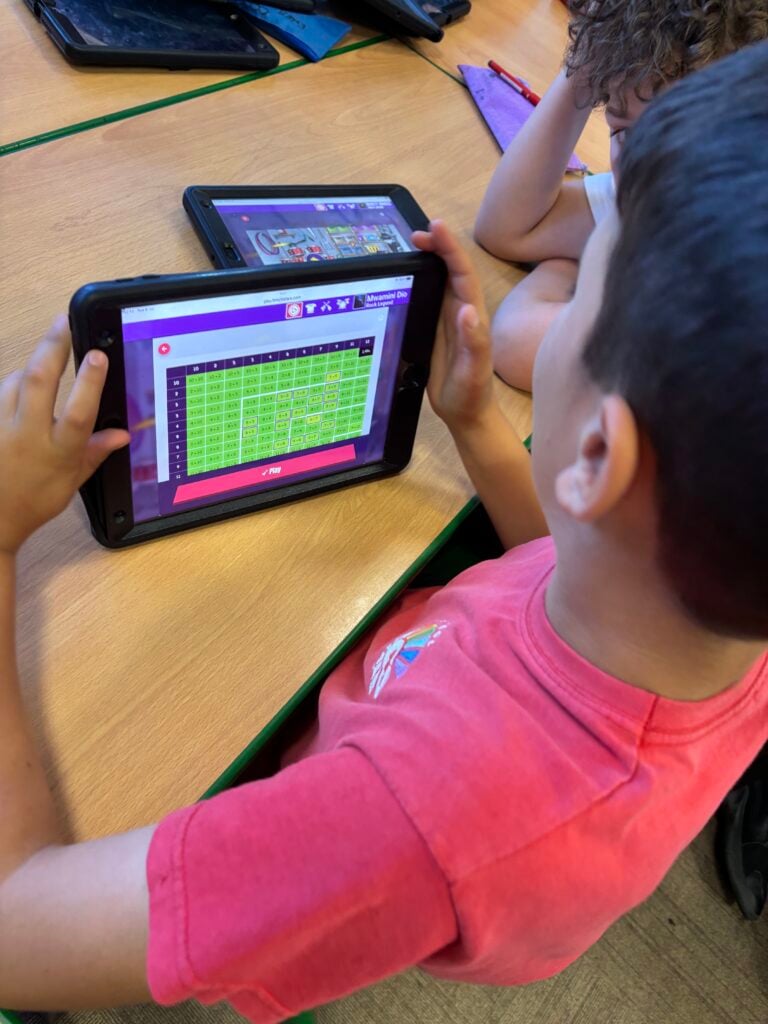
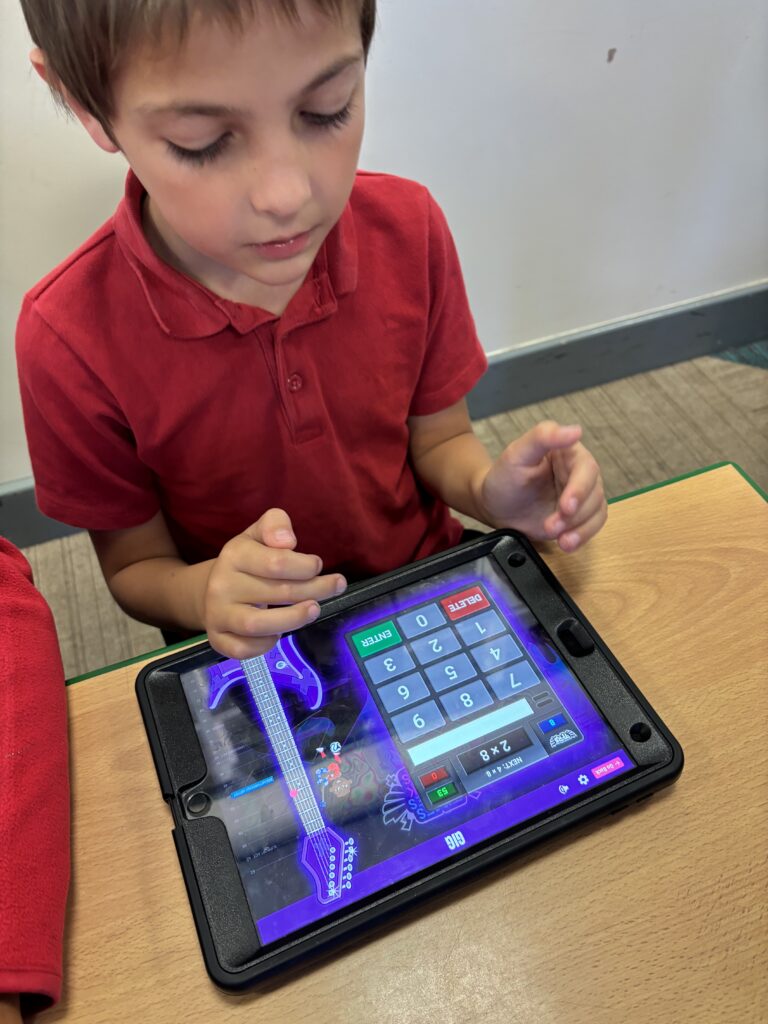
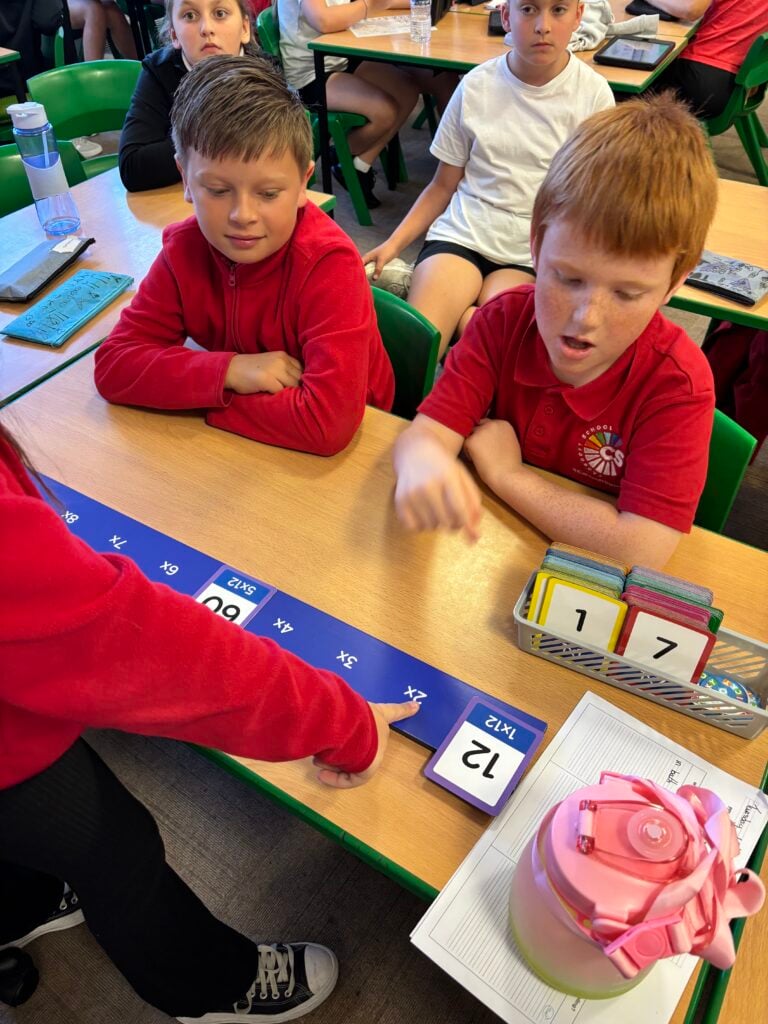
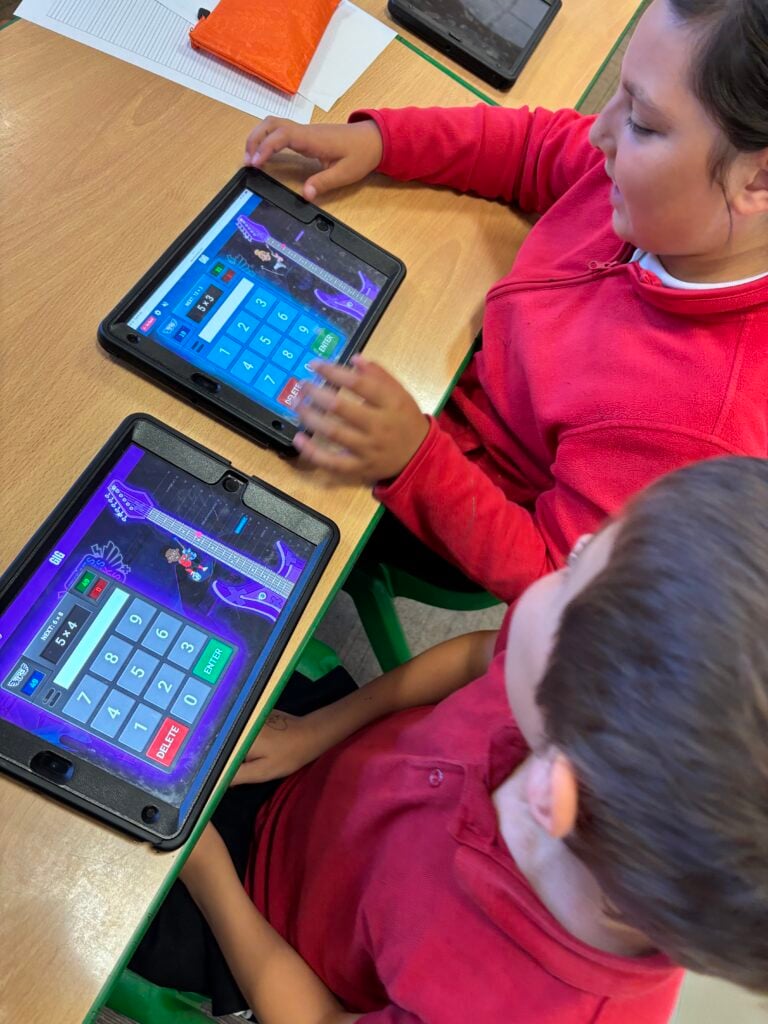
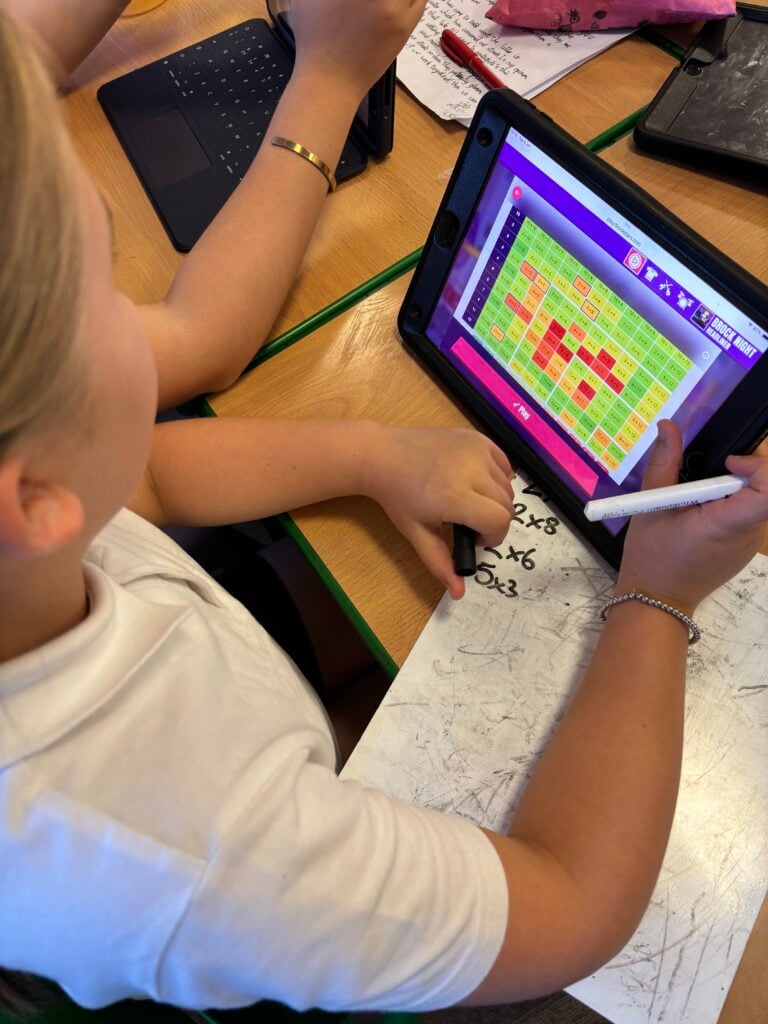
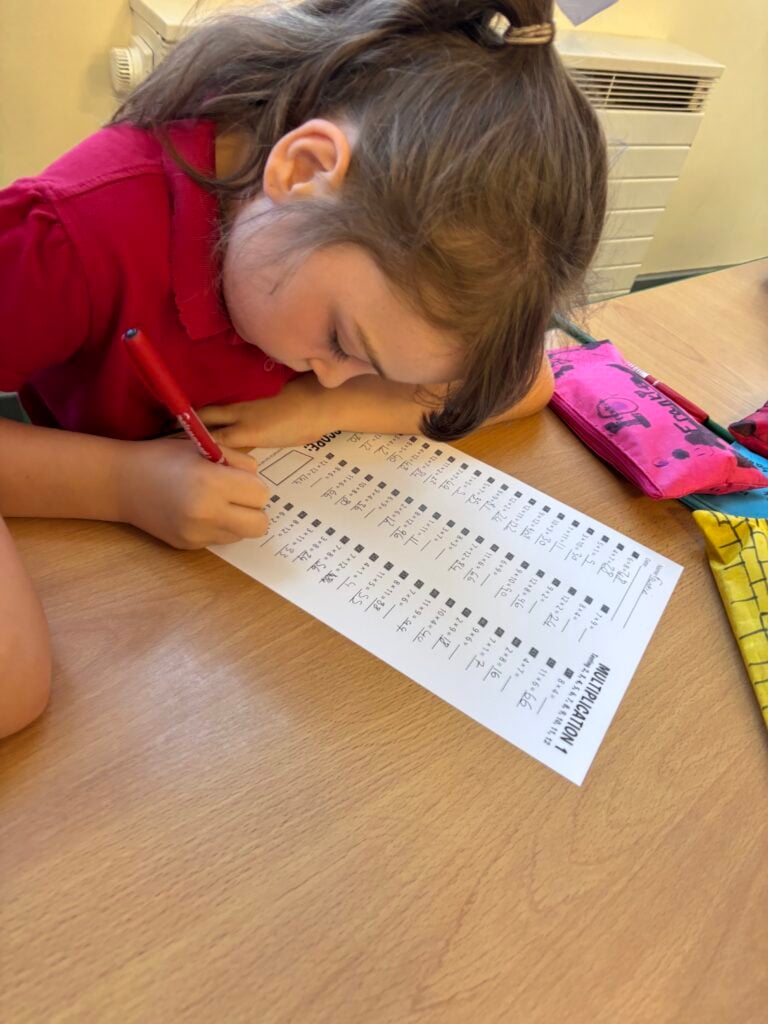
This week, our crew has taken part in a times table carousel, taking part in four different activities: times table stick, TT Rock Stars Battle, heat map challenge with a friend (testing their friends knowledge on any times tables that are not green) and a times table worksheet. We began in one group and then moved around the room to take part in each challenge.
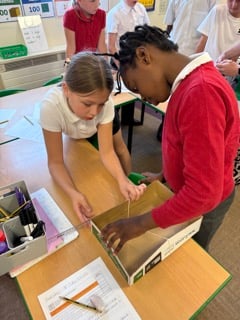
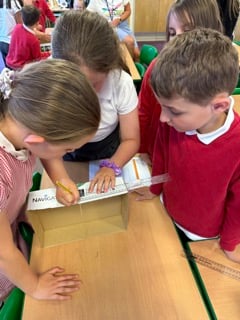
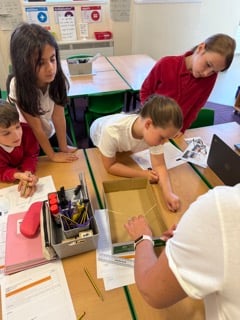
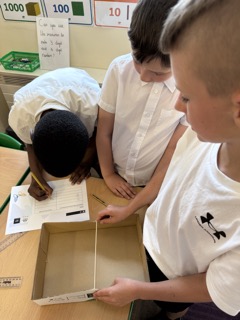
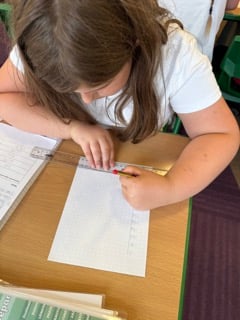
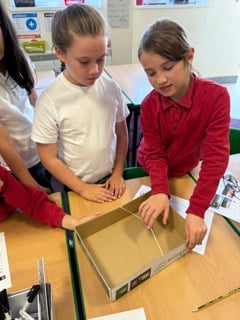
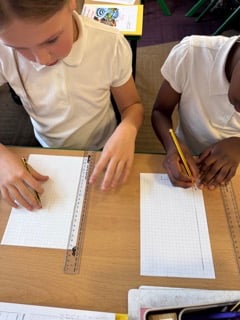
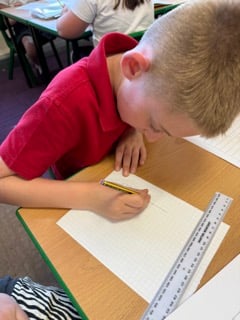
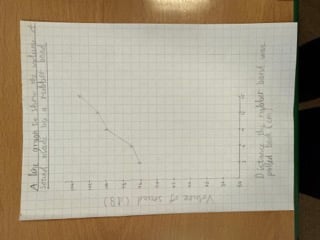
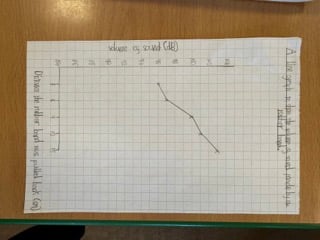
In expedition, we conducted an experiment to investigate how the volume of sound made is affected by the distance a rubber band is pulled back. We placed a rubber band around the carboard box and pulled it back different distances. We measured the sound it made using a sound meter. We then recorded these results in a table. We concluded that when the rubber band was pulled back further, it was louder. This was because the vibrations were larger. When the distance was shorter, it made a quieter sound. This was because the vibrations were smaller. We then used the results to draw a line graph. We used our recent maths knowledge (statistics) to help us figure out the scales for the axis. We were really resilient doing this and had some great line graphs!
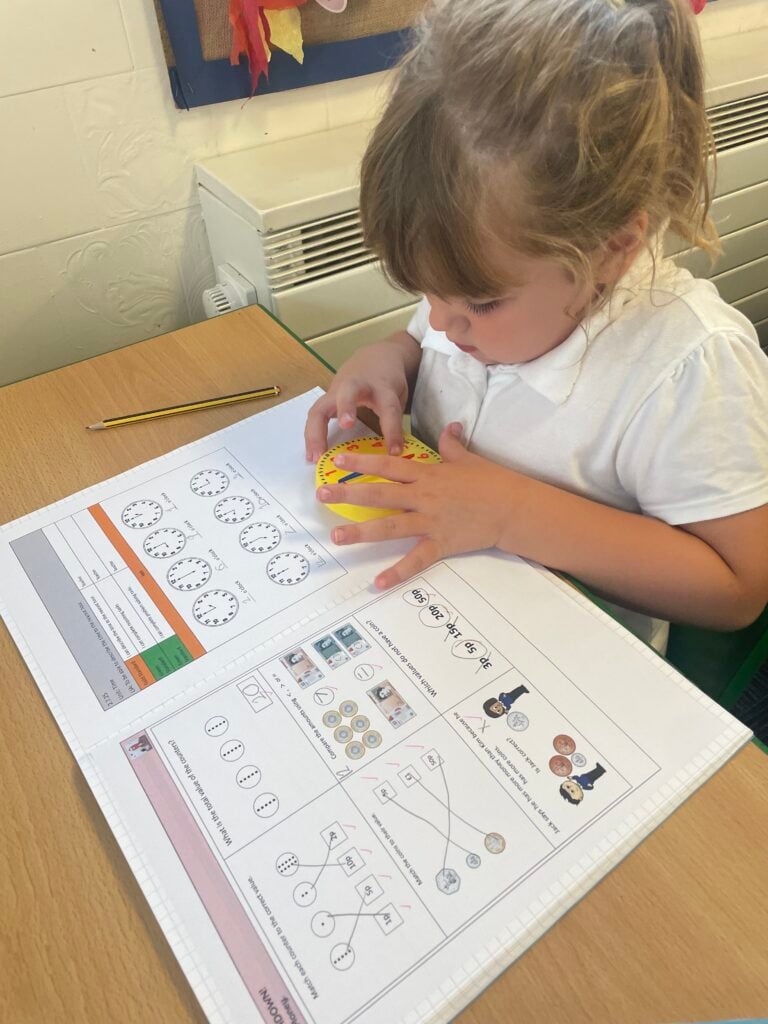
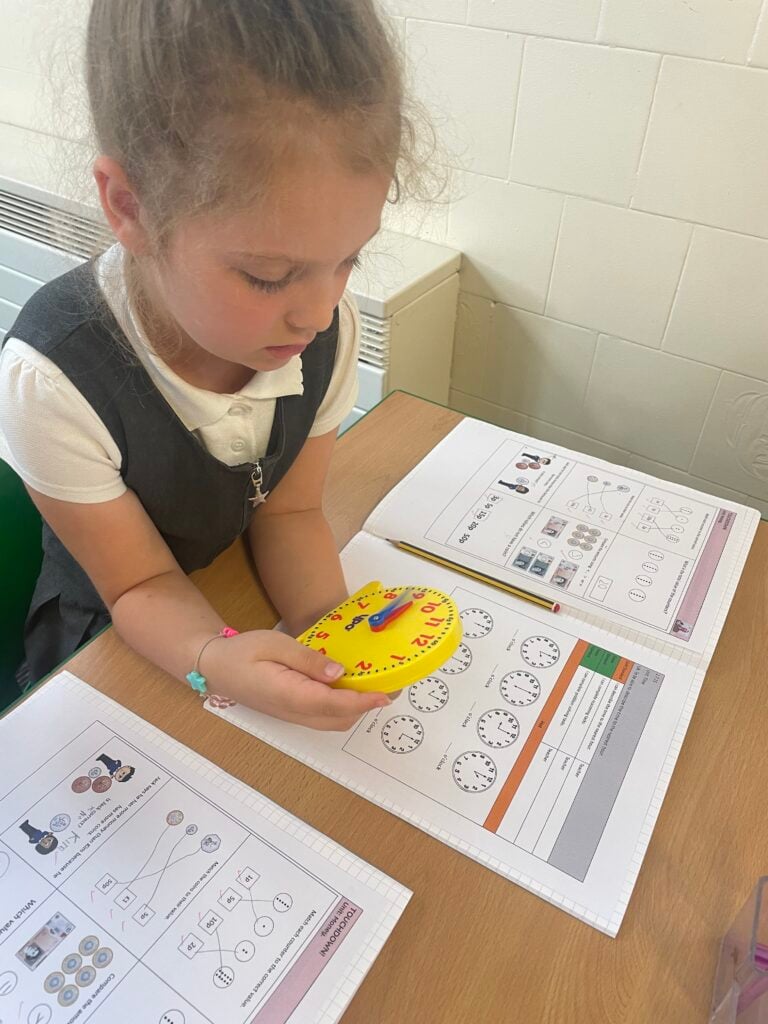
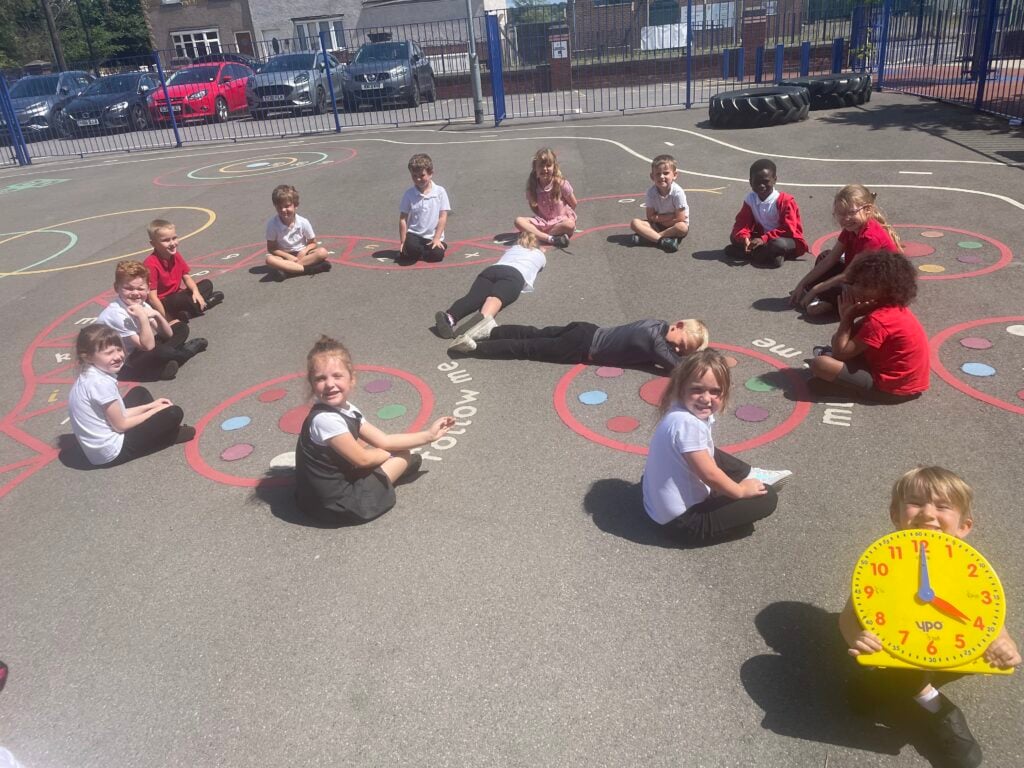
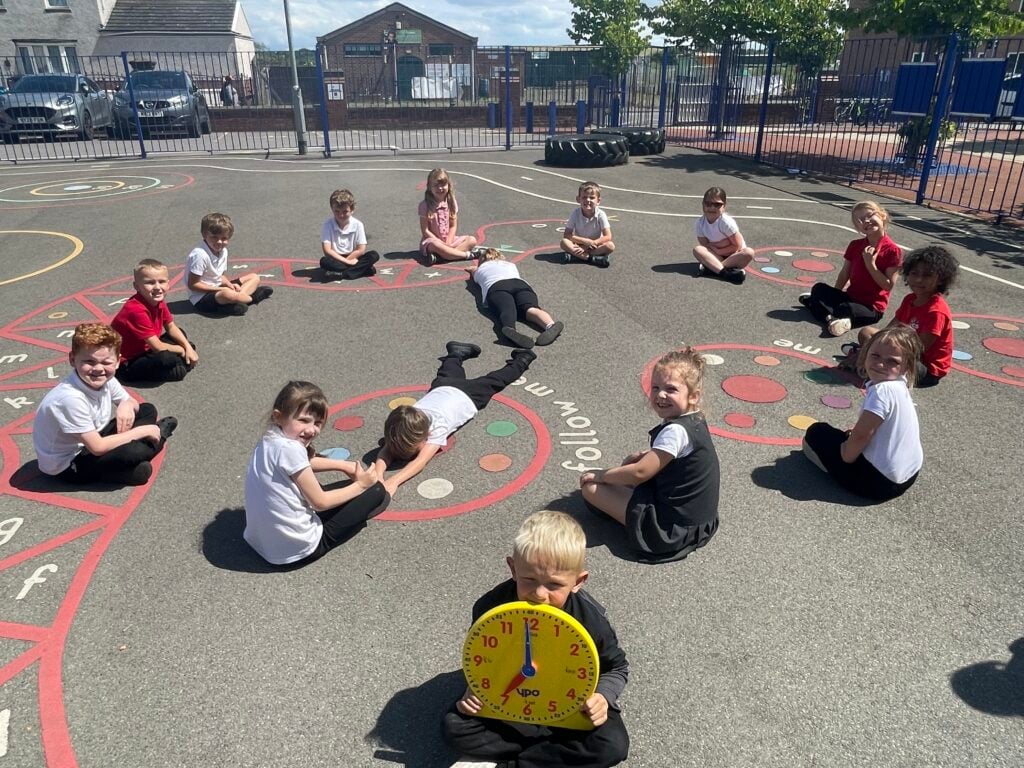
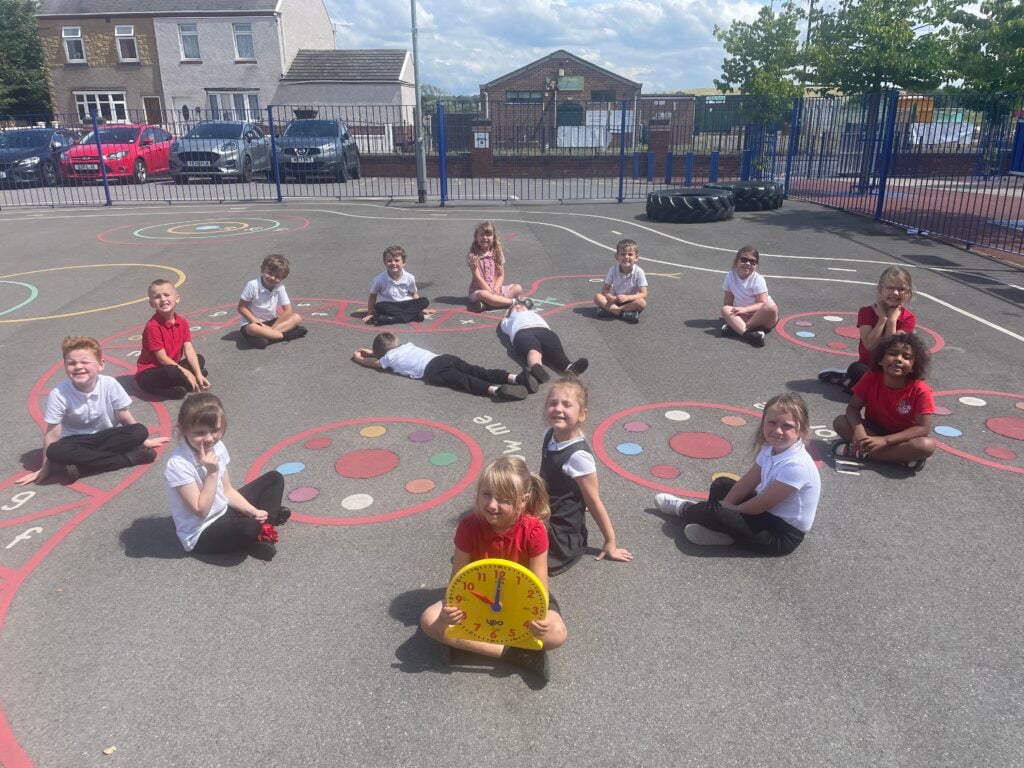
Today Crew Marsh have been learning how to tell the time, in particular o’clock and half past. They worked extremely hard using their own clocks to answer the questions in lesson and then we decided to challenge ourselves to create the time shown on a clock by using our bodies to represent the clock, the hour hand and the minute hand. Time really does fly when you’re having fun!