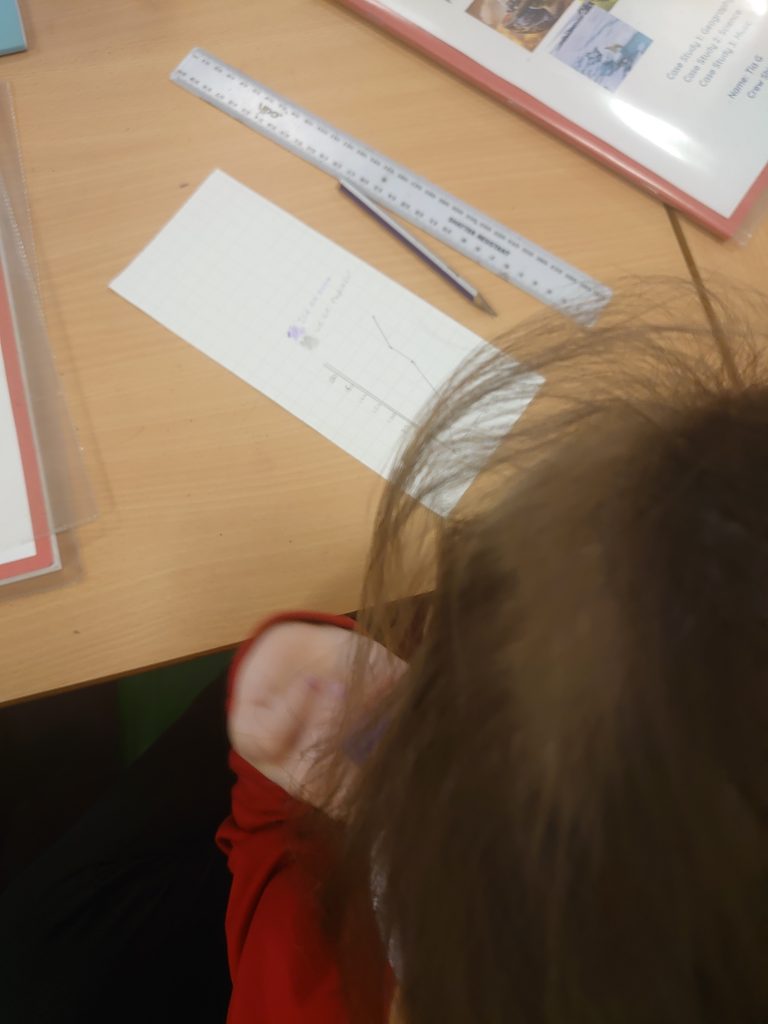
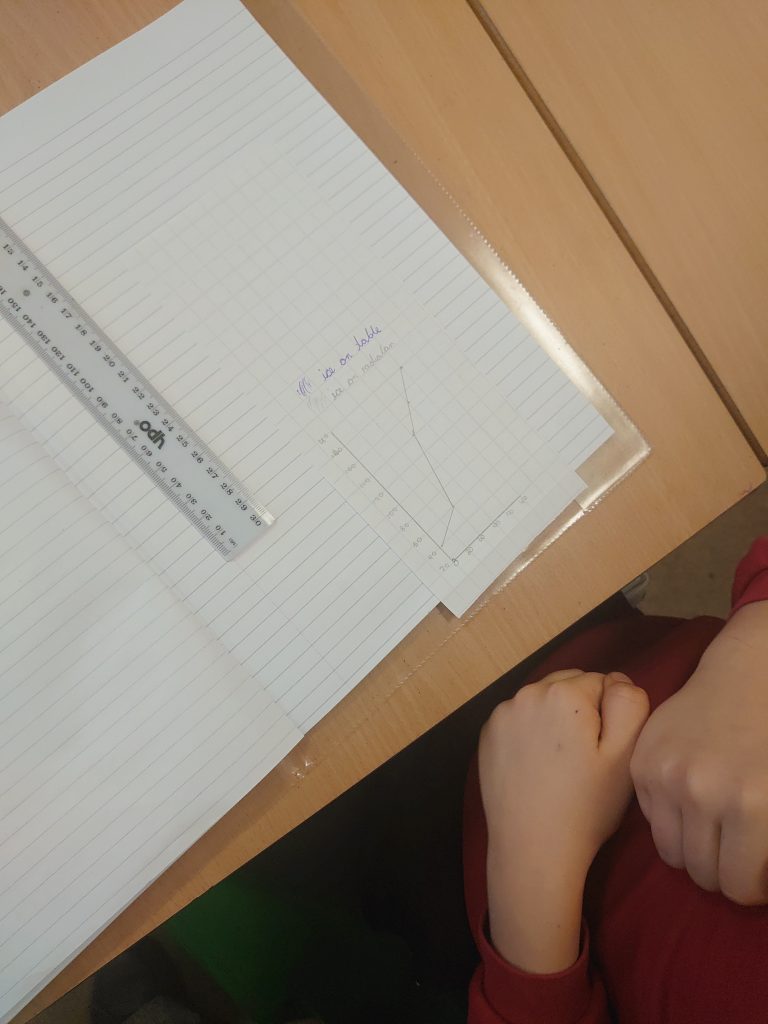
Yesterday afternoon, we recorded the results from our science experiment as a line graph. This allowed us to clearly see that the water on the radiator melted at a much quicker rate than the one on the table and one still in the freezer. We were able to make links with this to global warming and the fact the ice caps at melting at a faster rate due to the Earth warming up.