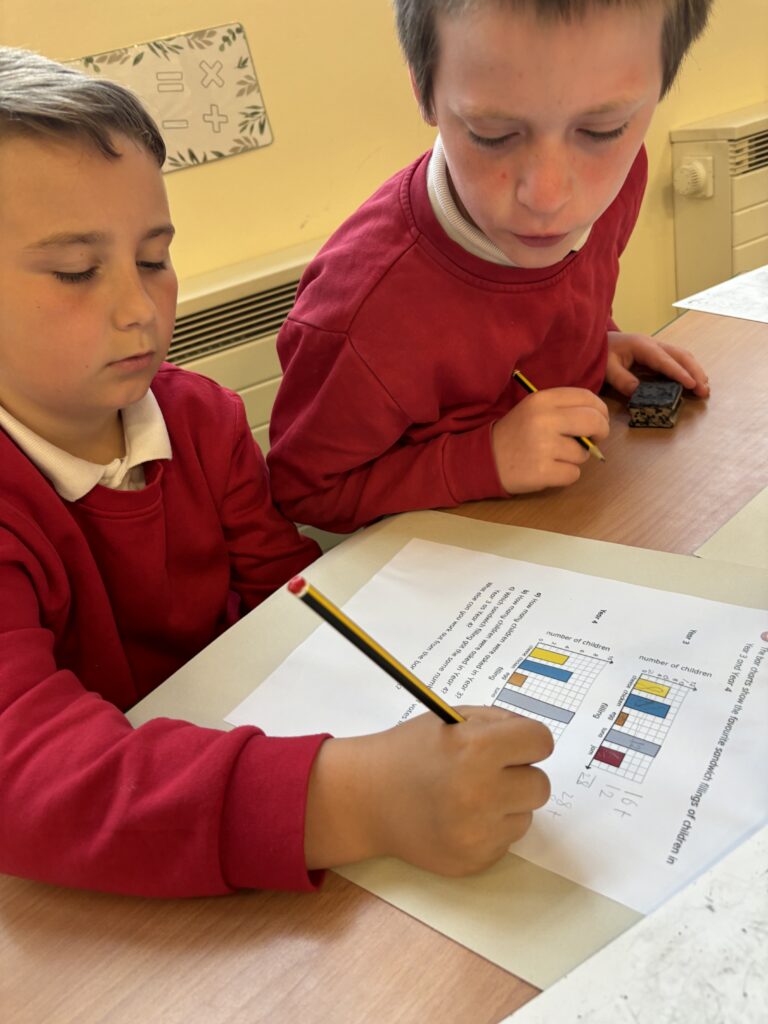
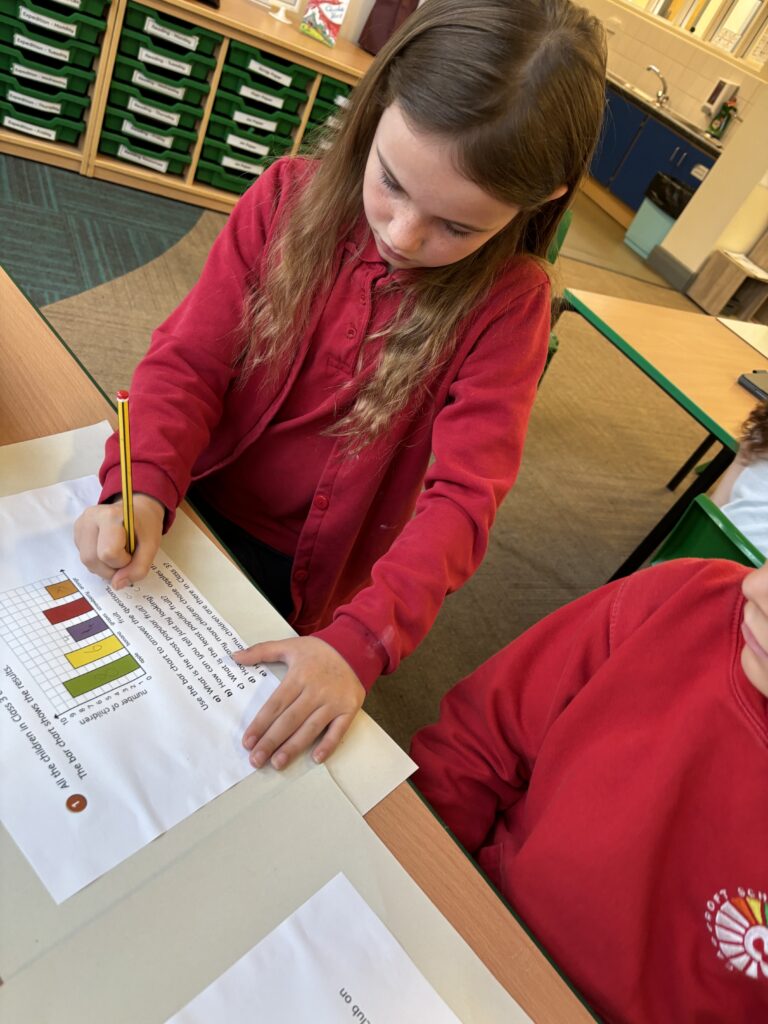
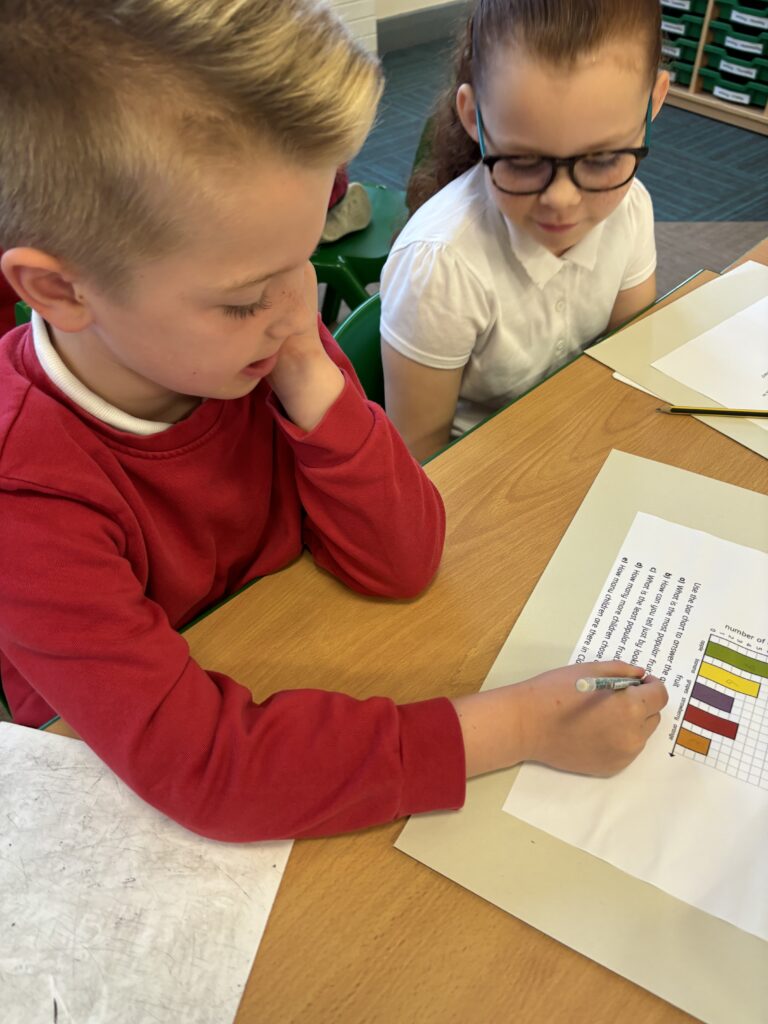
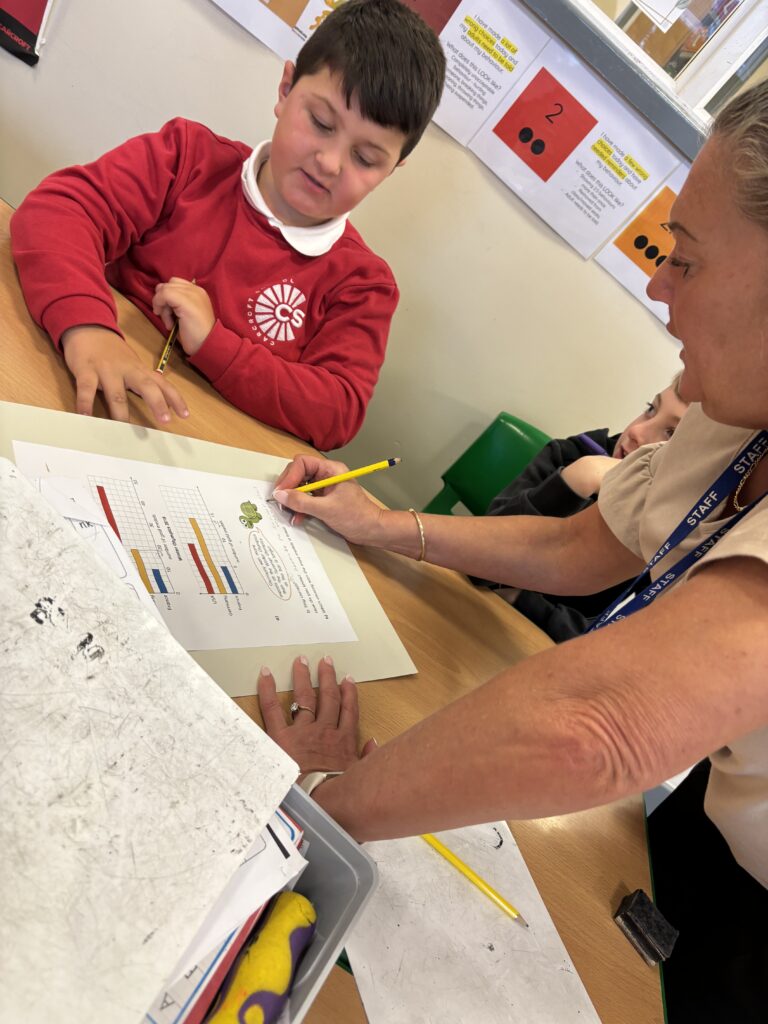
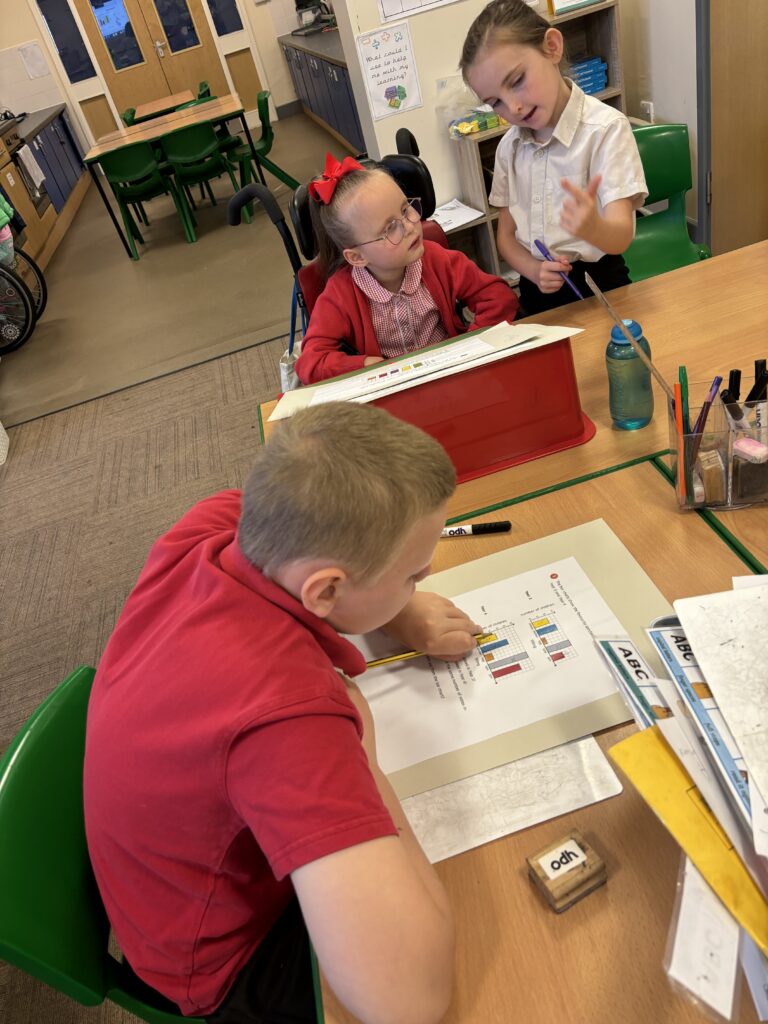
To complete our statistics unit in maths, Crew Hamill began by learning how to interpret bar charts. We looked at what a bar chart was and worked as a crew to discuss what different bar charts were illustrating. We then worked in mini crews to answer questions on what the bar charts were showing us. After this, we used the information we gathered when completing pictograms and this time illustrated the data in our own bar charts.